An Introduction to Remote Sensing
This chapter is an attempt to comprehend Remote Sensing. To reach a basic understanding so that it becomes a bit easier to understand future lectures and reading supporting material. As a visual learner, I have opted for a visual representation of many concepts or processes, as it works for me (kindly feel welcome to search for the theory).
So lets understand few basic…
How does this work?
What are these bands?
Is this word a satellite or a sensor?
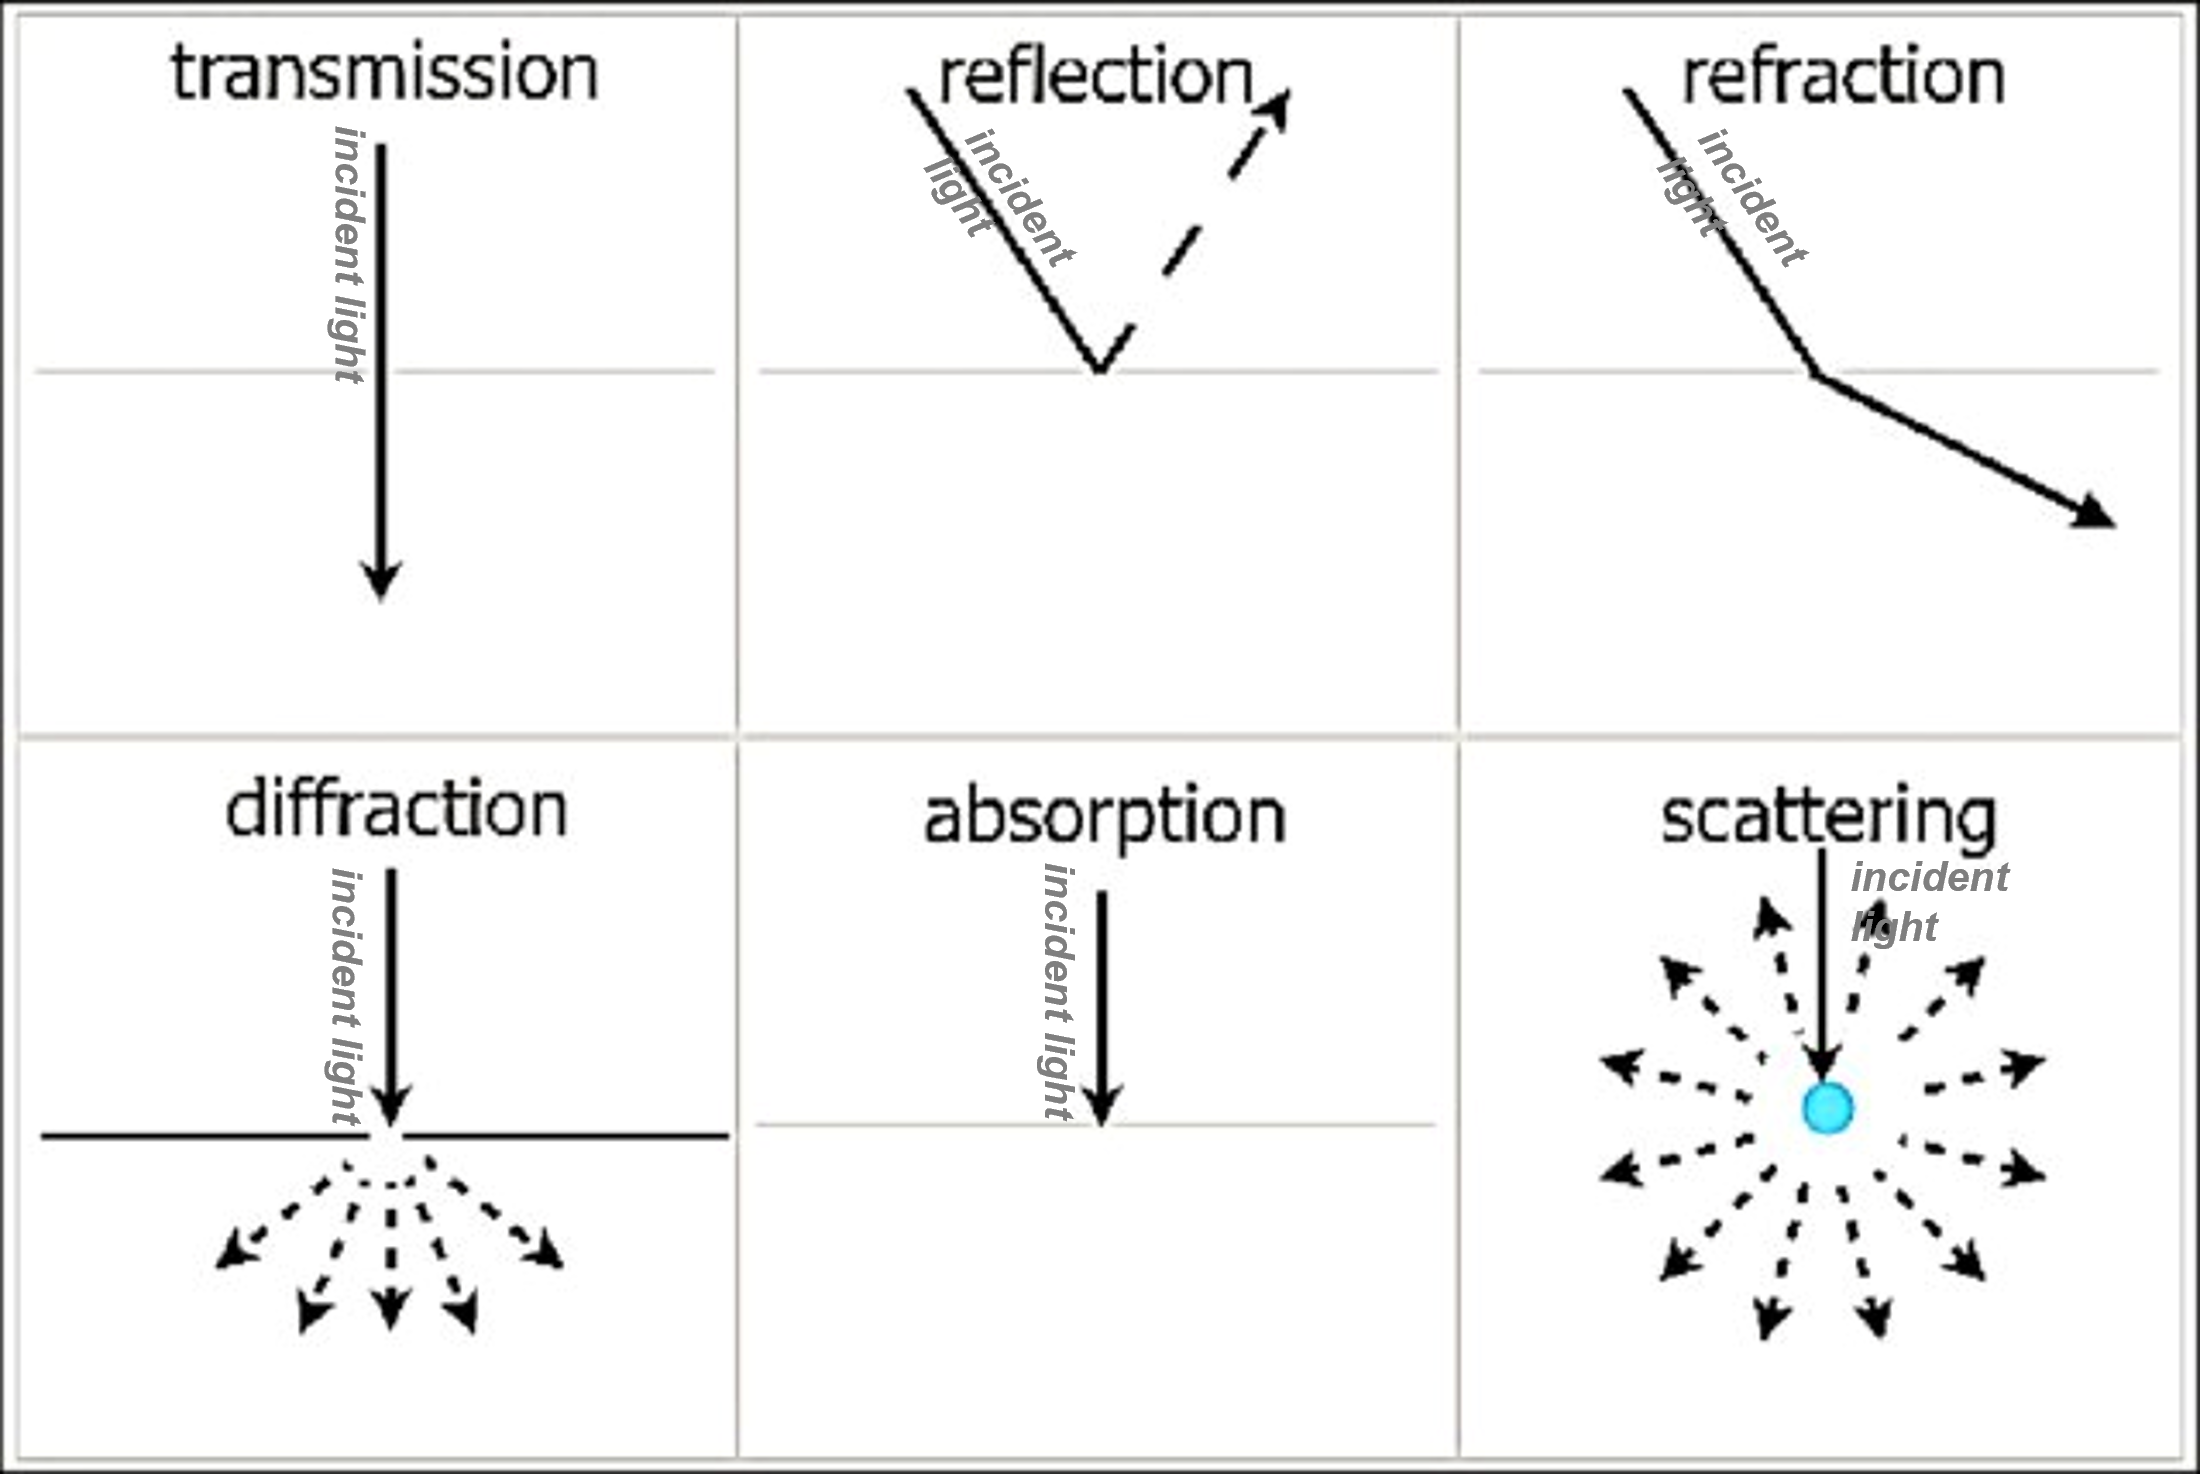
Terms
Below indicated are the images that schematically depict few terms.

![]()
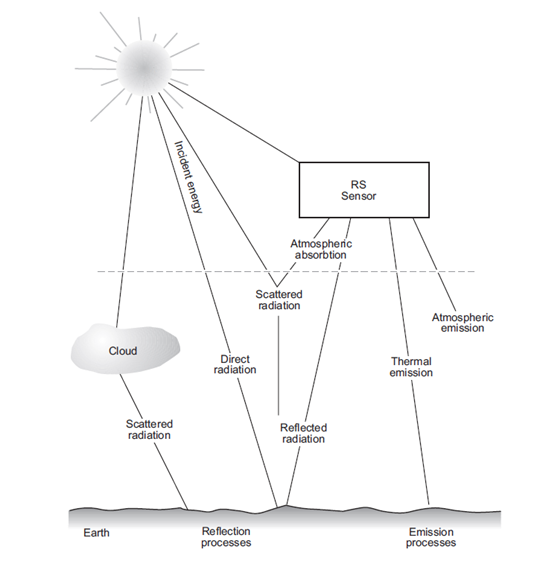
Remote Sensing Process
“Remote sensing combines science and technology to acquire information about an object, area, or phenomenon by measuring reflected and emitted radiation using a device that’s without direct physical contact (typically from satellite or aircraft)” geospatialuk
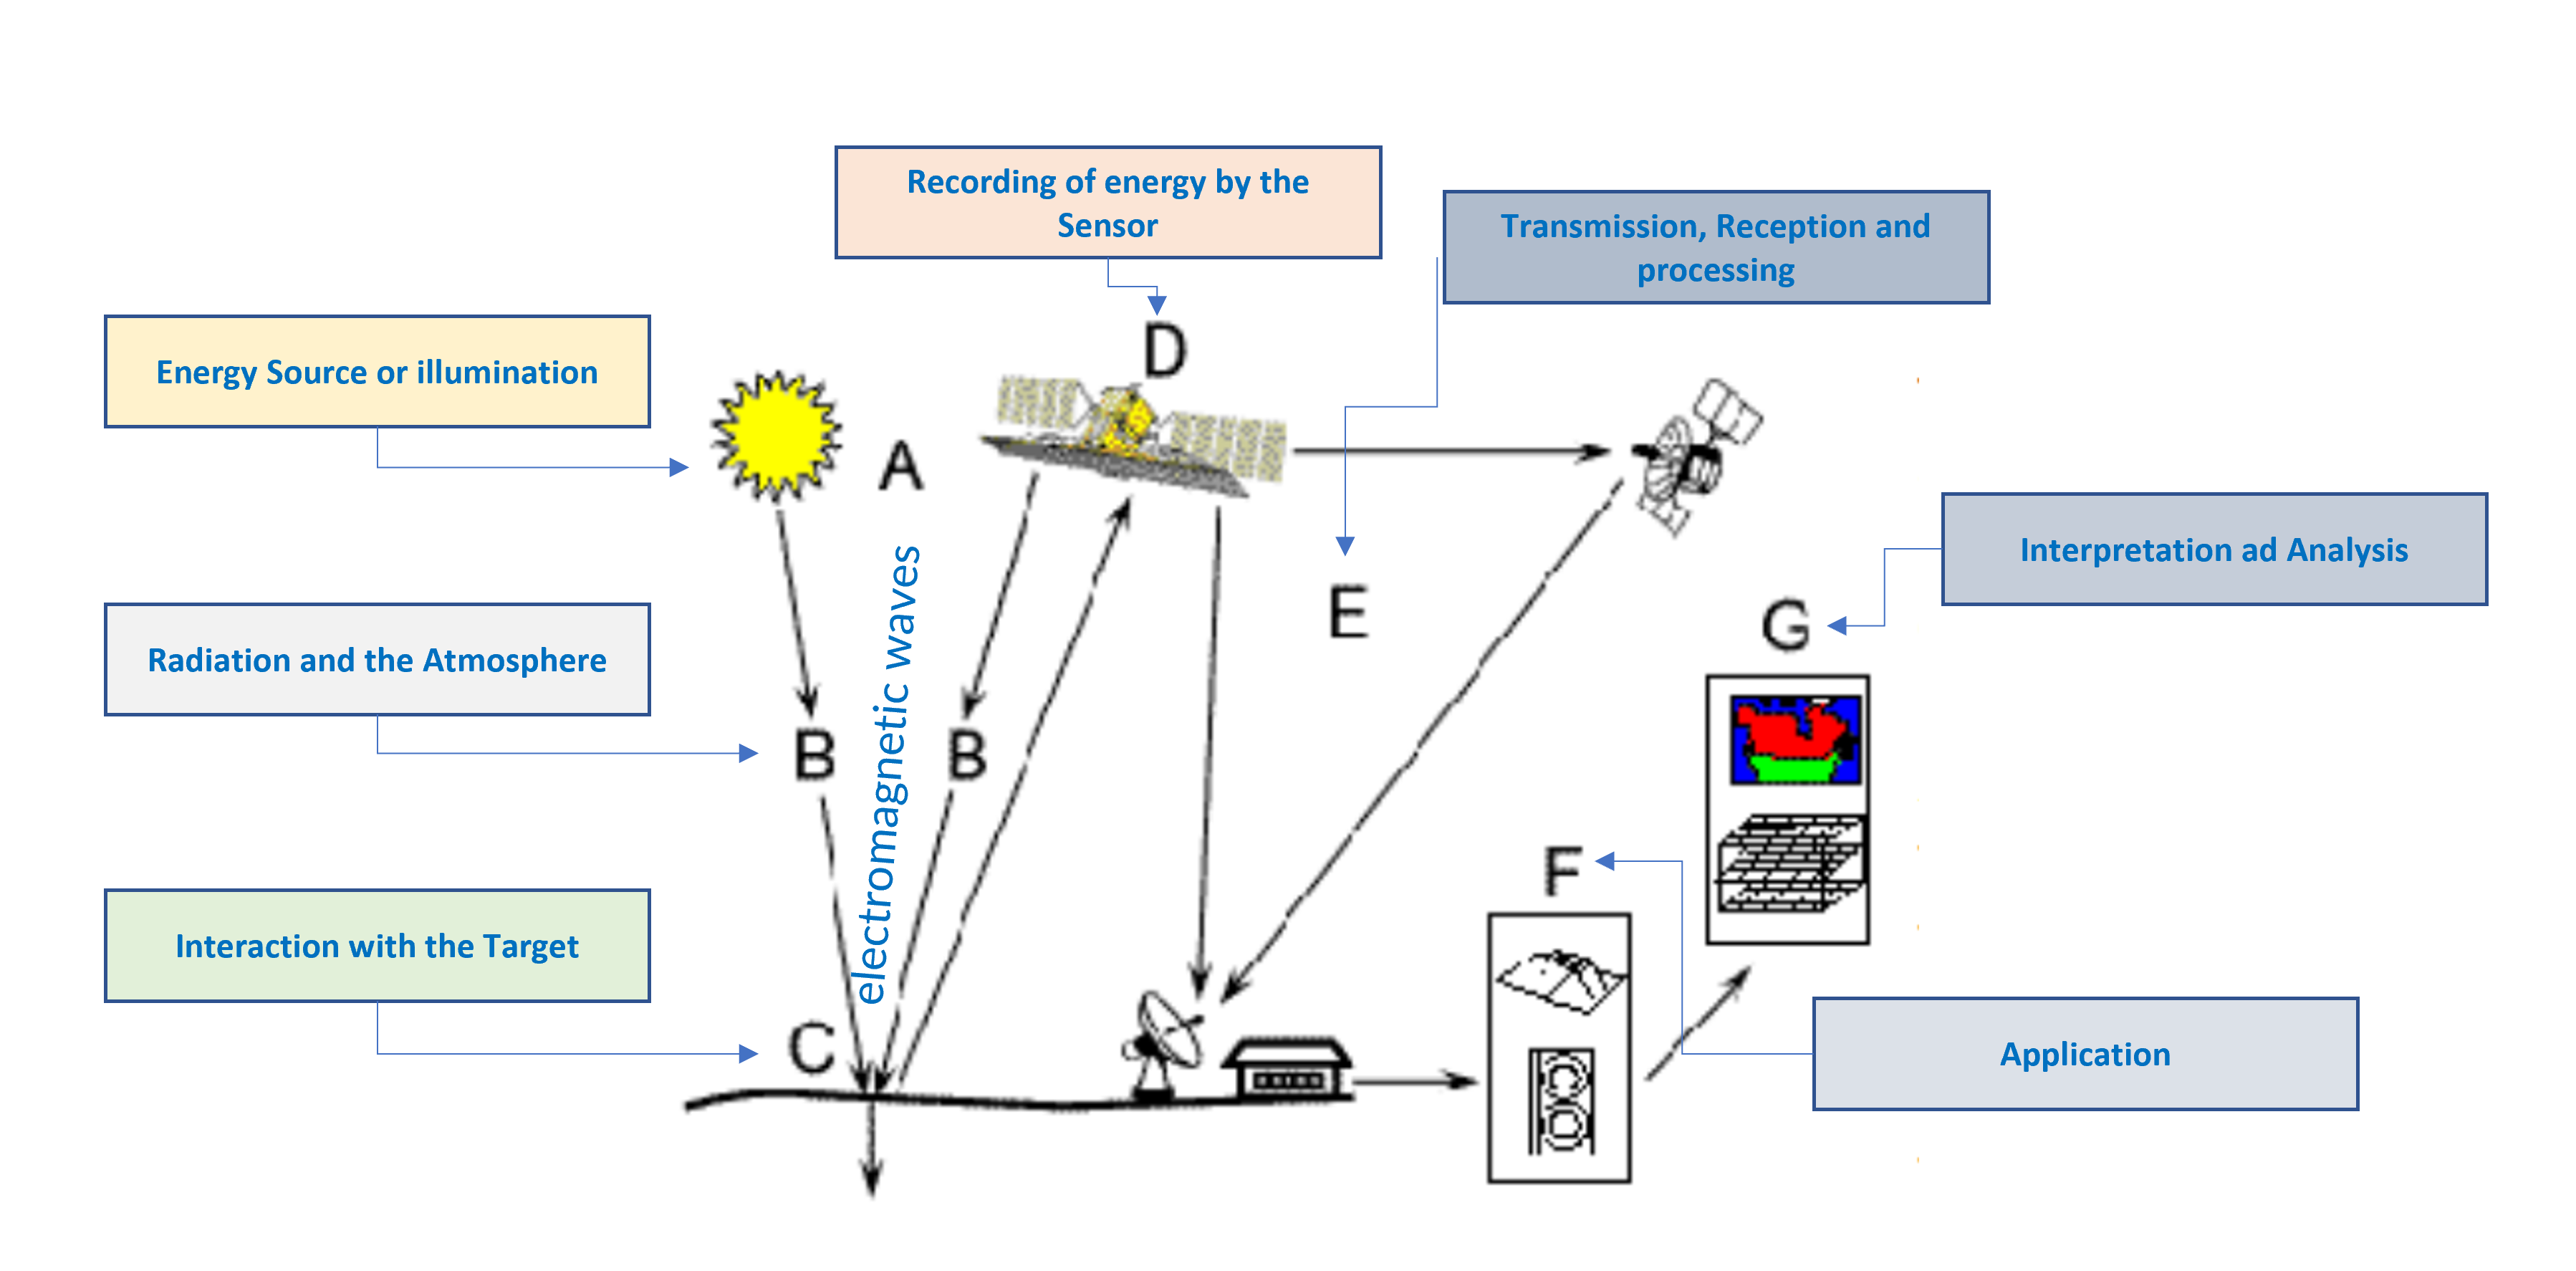
The following table explains the process represented in the above image.
| Code | Interaction | Process |
|---|---|---|
| A | Energy Source or illumination | Energy form:
Energy source which
|
| B | Radiation and the Atmosphere | Energy and Atmosphere Interaction: 2 Energy Travelling pattern:
|
| C | Interaction with the Target | Energy and Target Interaction dependencies:
|
| D | Recording of energy by the Sensor | Target energy output:
Sensor location: Remote (not in contact with the target) Sensor role:
|
| E | Transmission, Reception and processing | Sensor role:
Receiving and processing station role:
|
| F | Interpretation and Analysis | Processed target Image:
|
| G | Application | Interpretation application
|
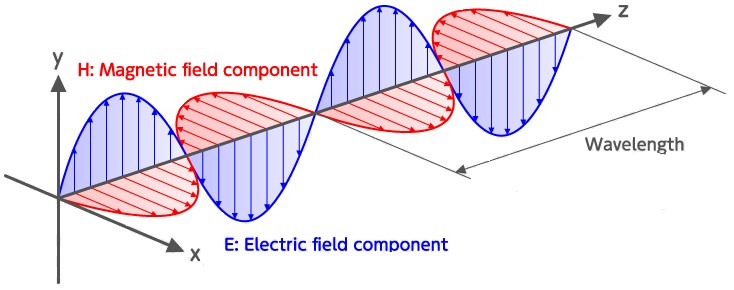
Electromagnetic Waves (EMW)
- Composition of oscillating electric and magnetic fields. (Maxwell’s equation)
- EM radiation transmission: can transmit in vacuum
- frequency, time period and wavelength= dependent on the producing source
- velocity= dependent on medium in which it is travelling
- high frequency of propagation= increase in accuracy
- light🌞 = visible part = colors (corresponding to different wavelength of light) eg: rainbow🌈
- Sound 🔊= invisible waves
- travels through molecules present in air (molecules bumping into each other)
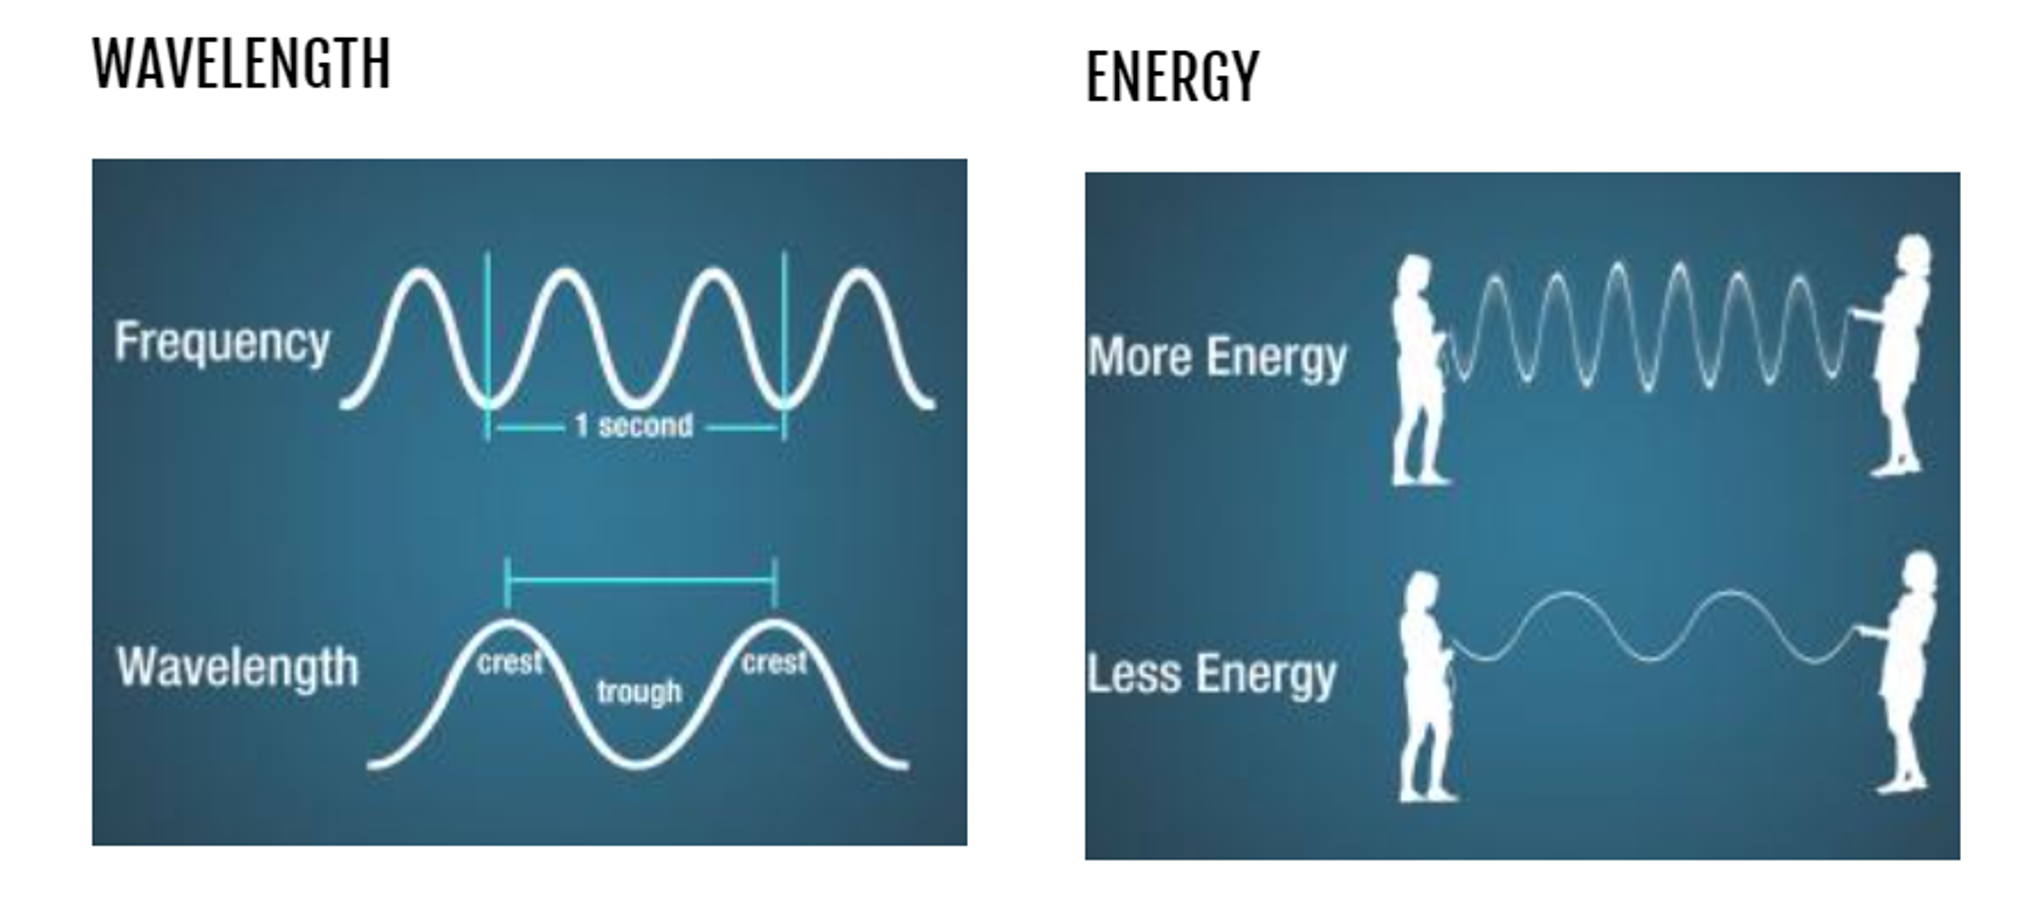
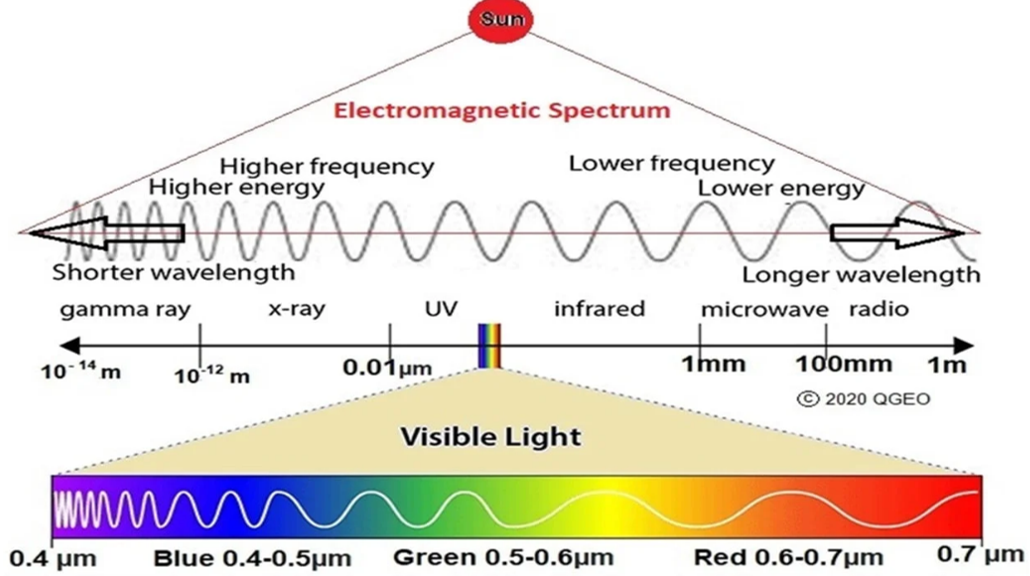
Longer wavelength = lower 🔽 energy = lower 🔽 frequency
Shorter wavelength = higher 🔼 energy = higher 🔼 frequency
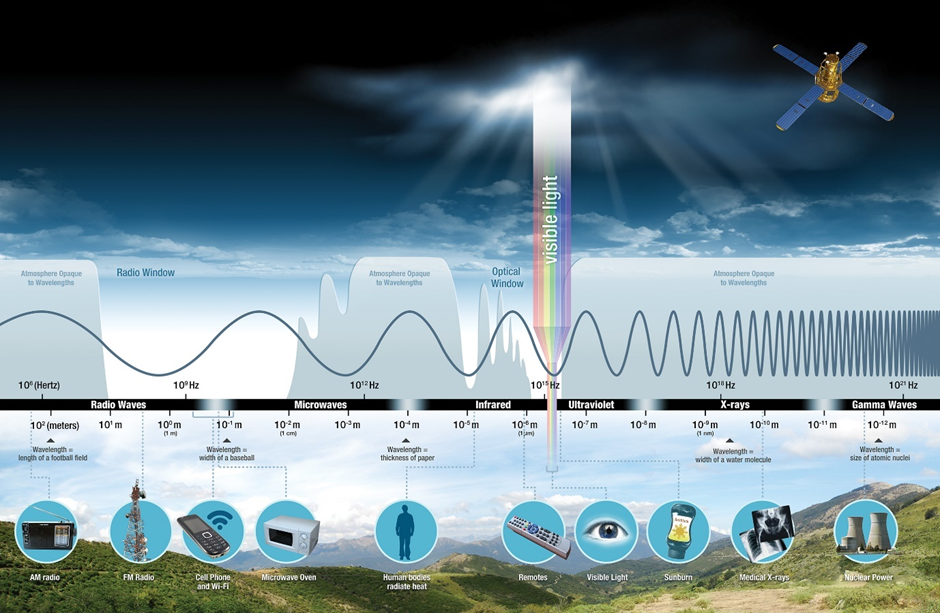
Wonder How BIG are these waves ??
Image below indicates EMW Radio upto Gamma.
- Radio waves = very long (size of a building to the size of a coin)
- gamma-rays = very smaller (atomic nuclei)
I see COLOUR? 👀
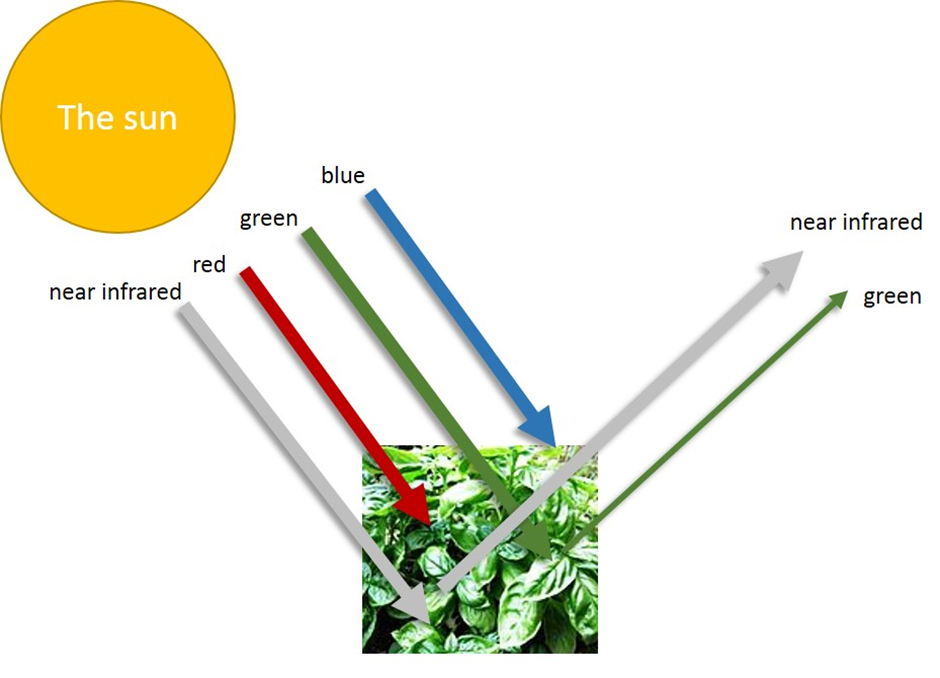
REFLECTED (Vegetation) = infrared light + infrared light= GREEN COLOR
- Geospatial data acquisition (Majority)= sensing (visible and infrared range)
- UV portion covers= shortest wavelengths (of practical use to earth observation)
- Application: some properties of minerals
- familiar application: UV rays used to detect forged bank notes
- Microwaves=larger wave length
- Application: information on surface roughness and moisture content of soils
- Green=0.54 μm (solar radiation maximum intensity)
- Red and beyond=IR (Infra-red)
- IR familiar application: night vision security cameras
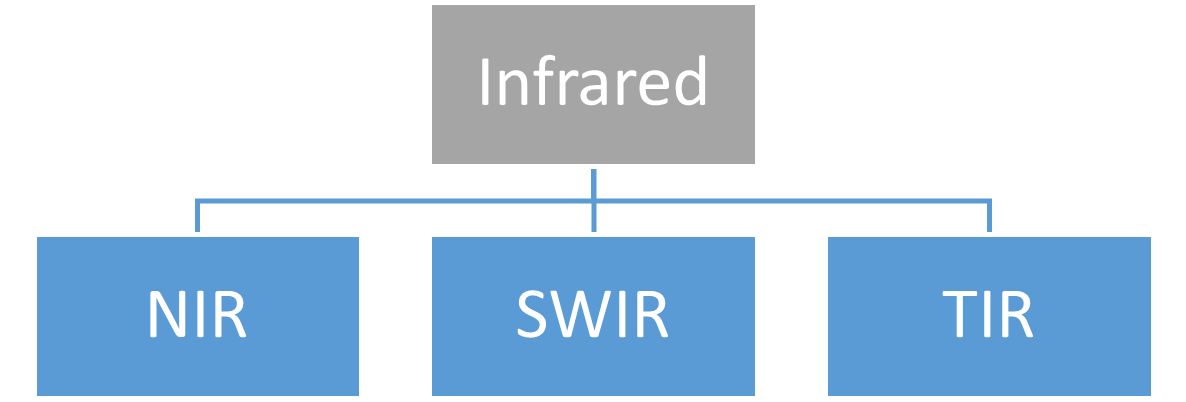
Infrared
- Near-infrared (NIR)
- Mid-IR (SWIR- short-wave infrared)
- Thermal Infrared (TIR)
| NIR | SWIR | TIR |
|---|---|---|
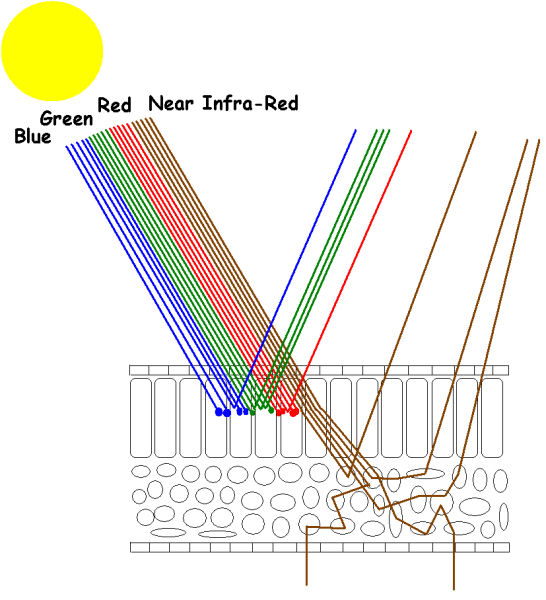
To under stand this better lets take an example of deciduous forest NIR energy:
|
MID-IR aka SWIR
|
|
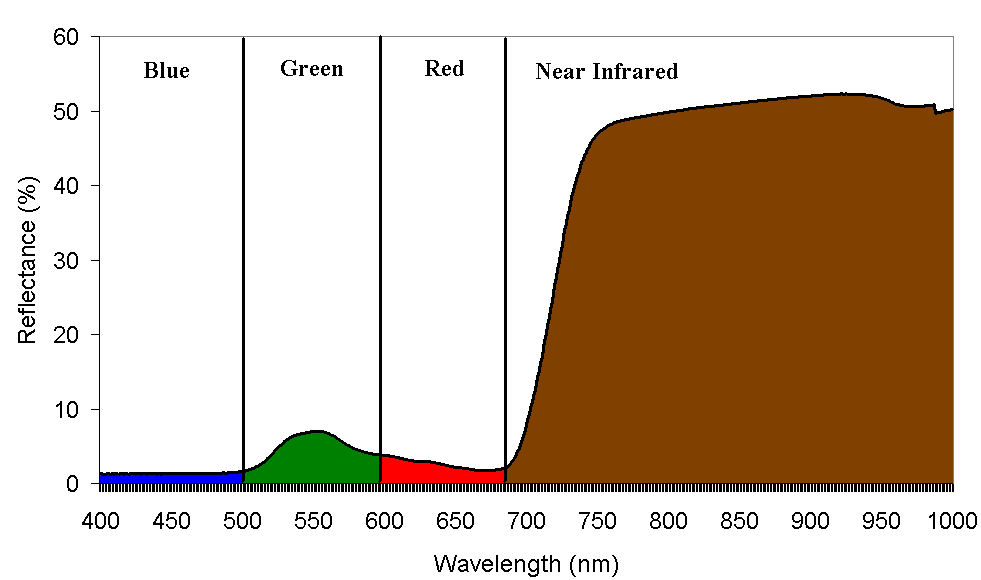
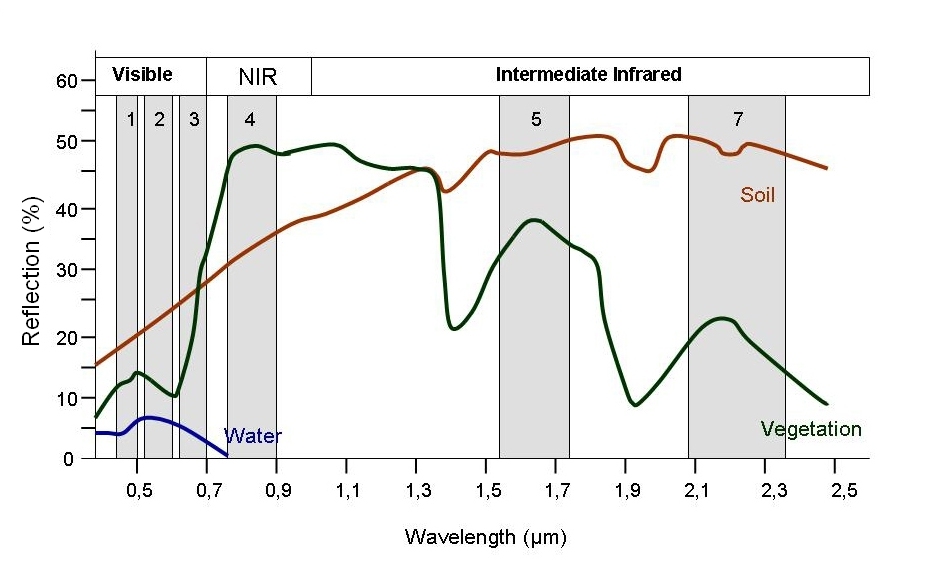
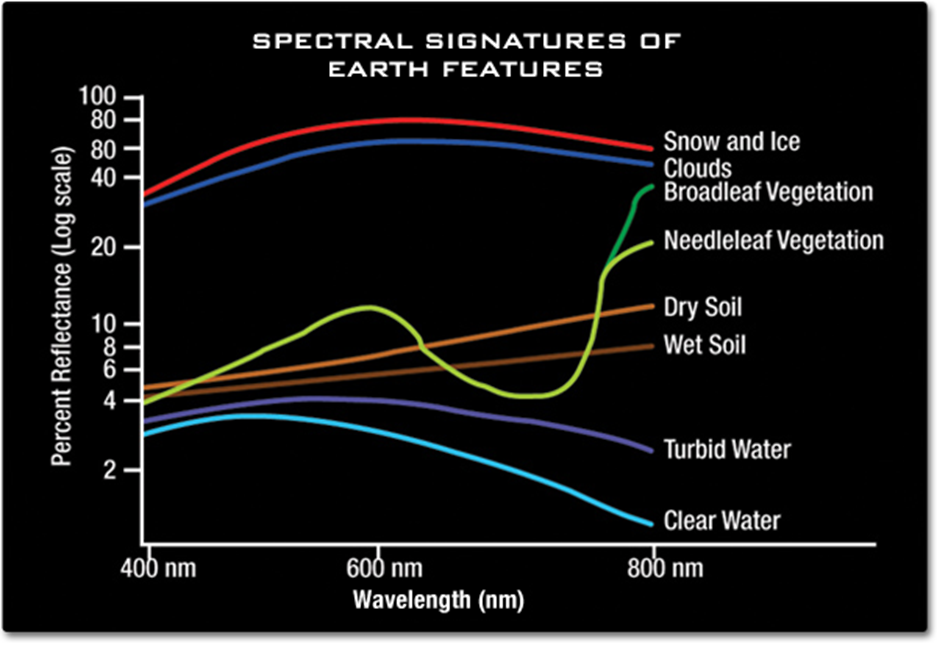
Spectral Reflectance Properties
So how do we see these characteristics of earth surface features or materials??
Spectral Reflectance Properties!! By analysing spectral reflectance patterns or spectral signatures.
Signatures can be visualised in spectral reflectance curves
Curves= function of wavelengths
- Eg: image below for water, soil and vegetation
EMW Interaction
In above sections we have looked into what is EMW and few applications. This segment we shall look into how it interacts when it travels.

Atmosphere
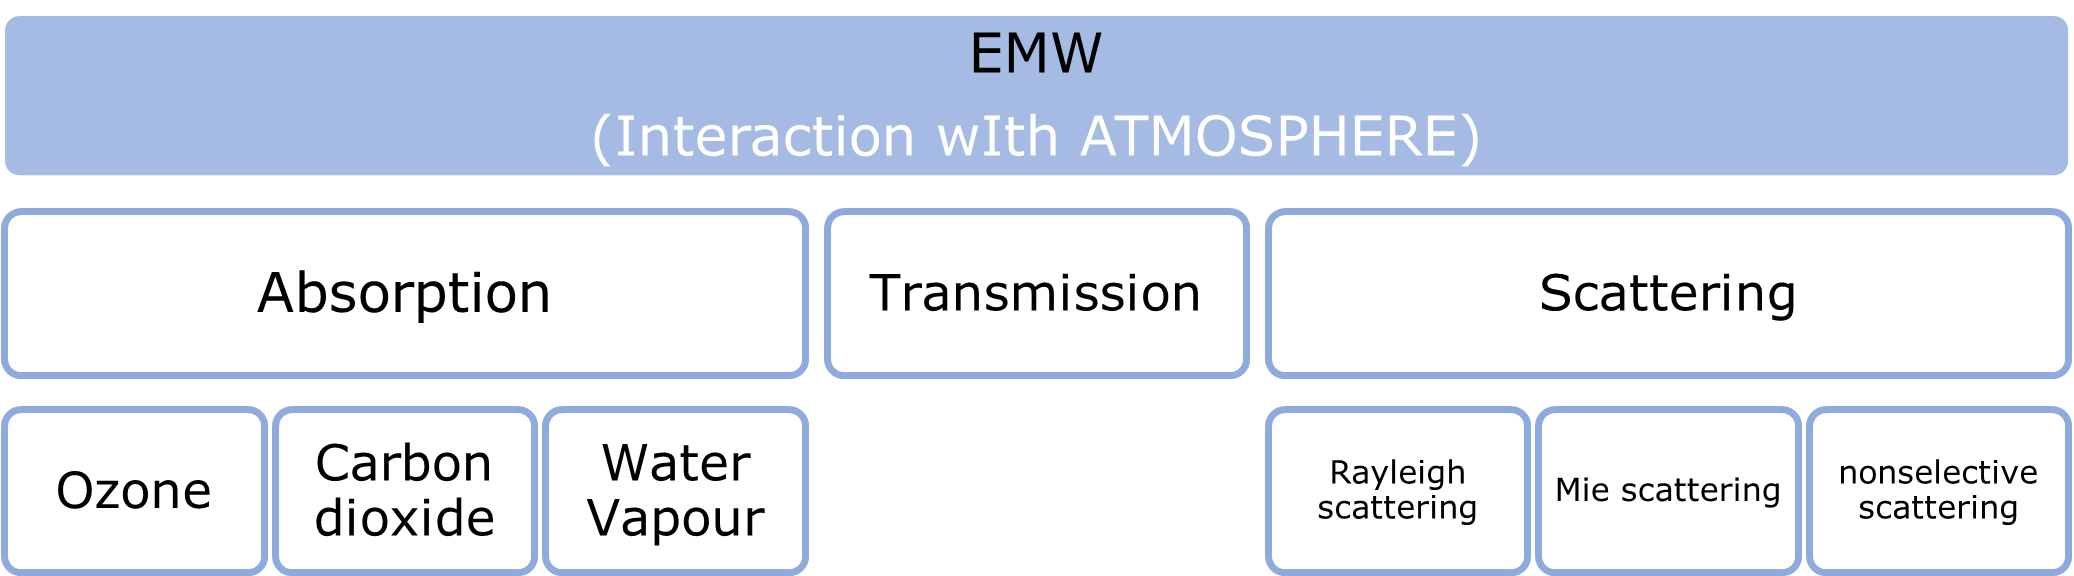
Absorption and Transmission
So let us look into the first two absorption and transmission

- Many wavelengths are not useful of RS of ES (none of the corresponding energy can penetrate the atmosphere)
- Spectrum portion outside the main absorption range= useful range
- Useful Range= Atmospheric Transmission Windows
- ONE window from 0.4 to 2 μm visible, NIR, SWIR remote sensors operating in this range are often referred to as optical ones
- THREE windows in the TIR range two narrow windows around 3 and 5 μm Third relatively broader approximately 8 to 14 μm
- Longer wavelength= strong absorption
- Range 22 μm to 1 mm
- Very low energy transmission
- Microwave range= transparent
- Range= beyond 1 mm
- Measure: solar radiation outside the atmosphere= resembles black-body radiation at 6000K
- Measure: Earth surface:
- Solar radiation at earth surface> spectral distribution of energy= very ragged
- Graph above:
- dip= atmospheric absorption by different gases
- energy>> earth surface= intensity reduction ? gas of increasing density.
Scattering
- Occurrence: passing from one medium (air,water etc) to another
- Light>>medium>>part light absorbed by medium>>
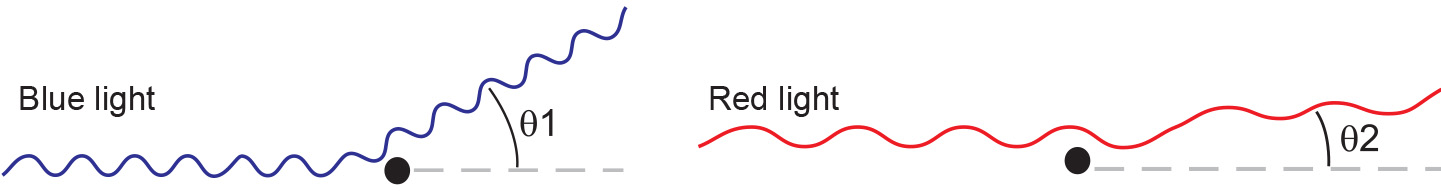
- Intensity of scattered light= size of particles + wavelength
- High scattering = short wavelength+high frequency (wavier= higher changes of collision with particles)
- Low scattering = longer wavelength+ low frequency (less wavier/ straighter in comparision= lower changes of collision with particles)
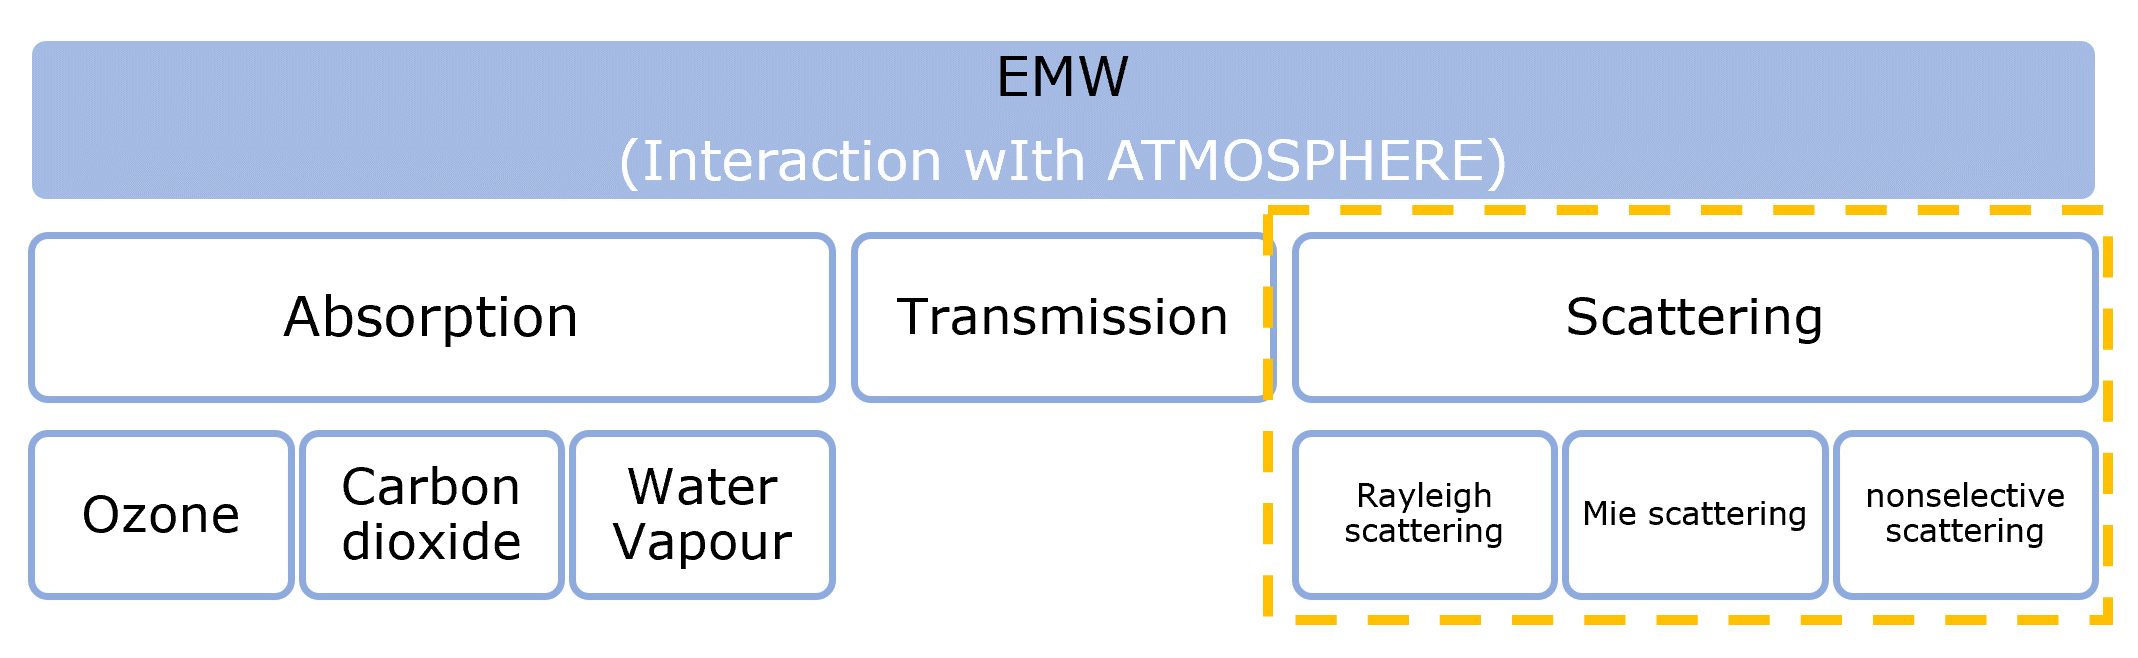
Factors:
- Wavelength of the radiation
- Amount of particles and gases
- Distance the radiant energy travels through the atmosphere
| Rayleigh Scattering | Mie Scattering | Nonselective scattering | |
|---|---|---|---|
| Particle size | Very small compared to wavelength (atmospheric particle size < incoming radiation wave length) 0.0001 μm to 0.001 μm |
Same as the wavelength of The radiation. (atmospheric particle size ~ incoming radiation wave length) 0.01 μm to 1.0 μm |
much larger than the radiation wavelength. (atmospheric particle size > incoming radiation wave length) 10 μm to 100 μm |
| Particles | Small specks of dust or nitrogen and oxygen molecules. | Dust, pollen, smoke and water vapour (larger particles) | water droplets and larger dust particle |
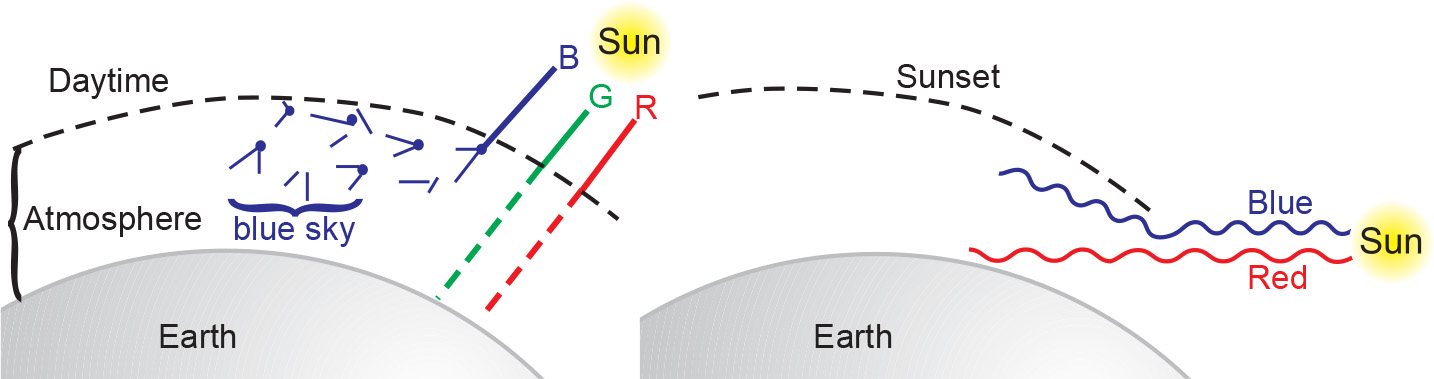
| Scattering result | Causes shorter wavelengths of energy to be scattered much more than longer wavelengths. | Affect longer wavelengths | independent of the wavelength within the optical range. |
| Location (dominant scattering mechanism) | Upper atmosphere | Lower portions of the atmosphere (dominates when cloud conditions are overcast) | |
| Effect on RS |
Negative effect on digital classification using data from multispectral sensors |
|
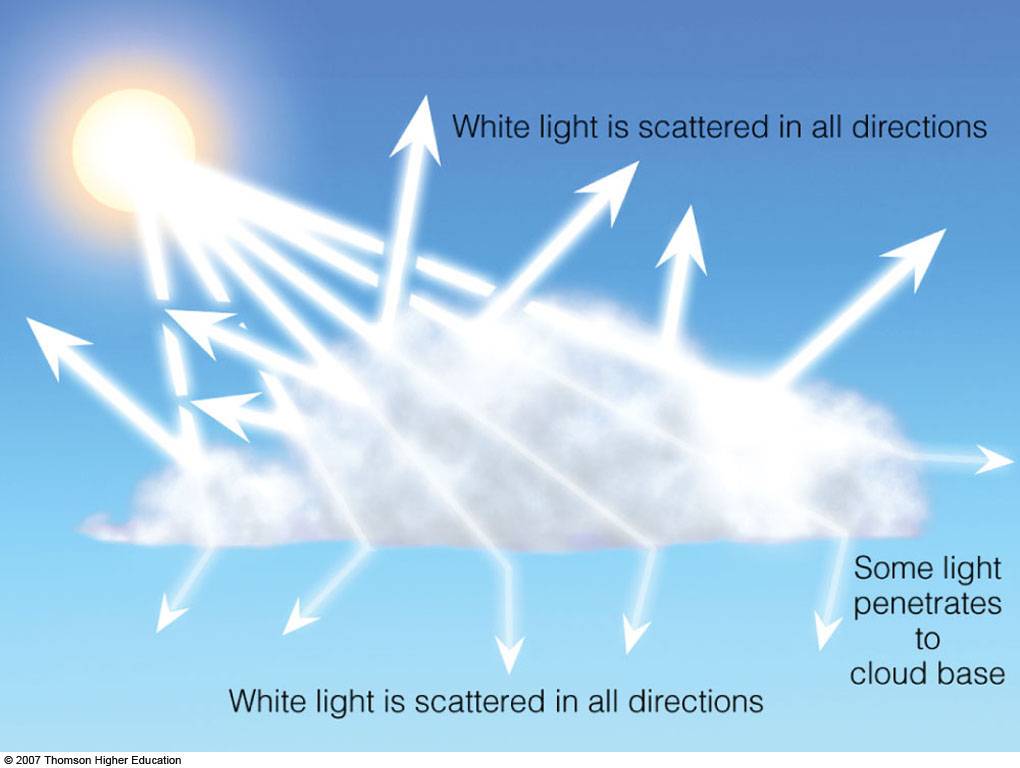
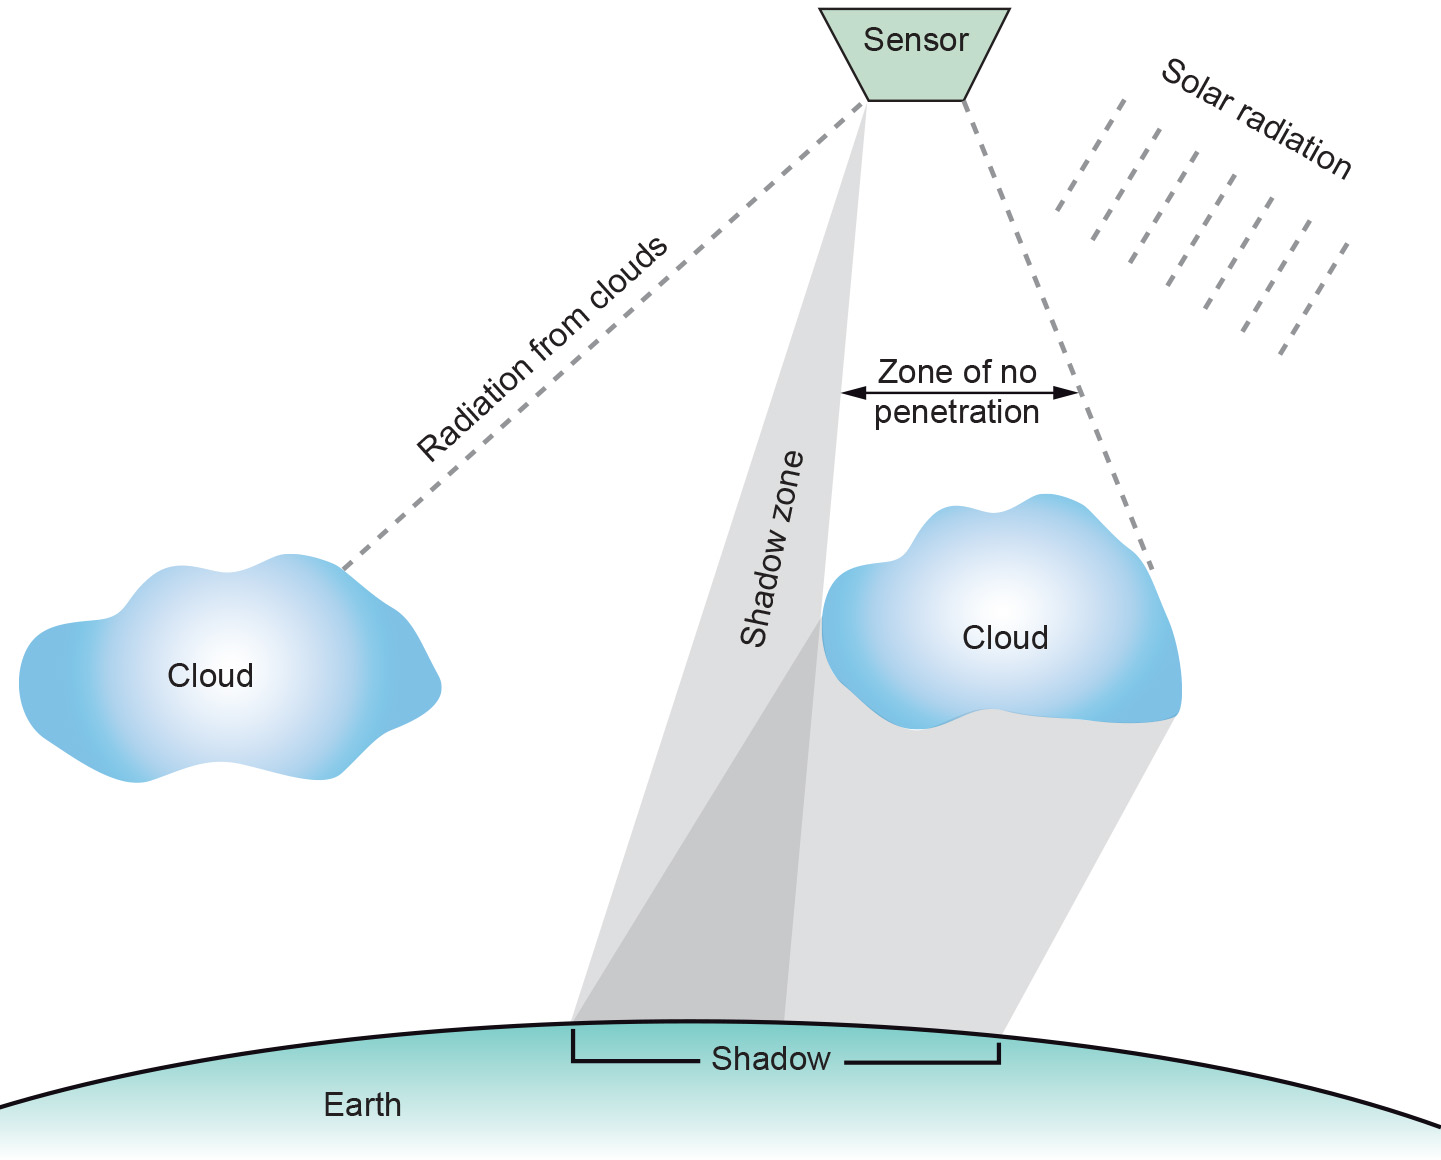
Clouds have a limiting effect on RS Eg: cloud cast |
| Example | Blue Sky, red sunset | dominates under overcast, cloudy conditions | clouds as white bodies |
| Wavelength | Blue (scattered more- shorter) | white light (scattered in all directions) |
|
| During the day |
|
||
| During sunrise and sunset |
|
Earth’s Surface

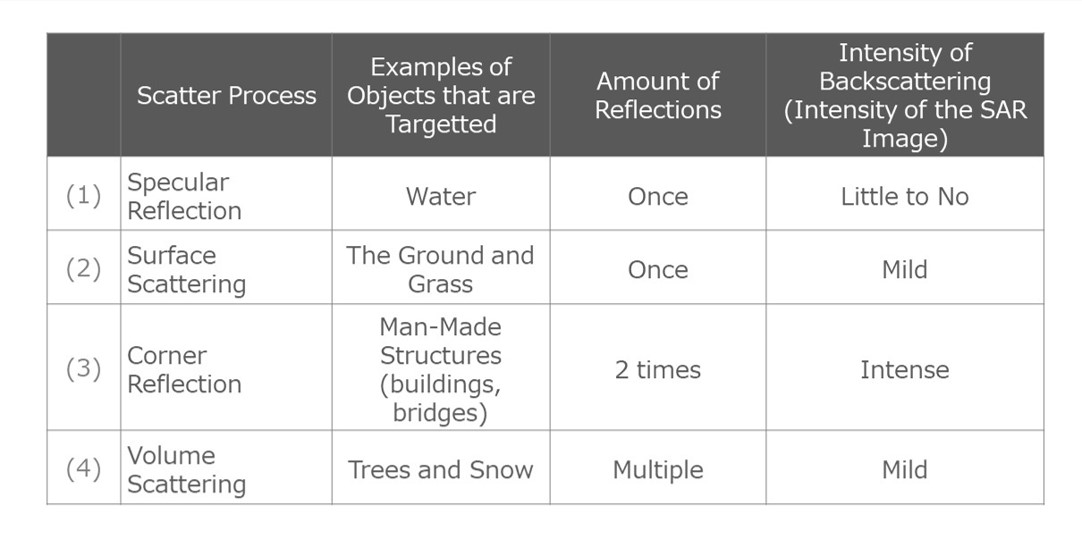
- The proportion of reflected - absorbed - transmitted energy will vary with wavelength and material type.
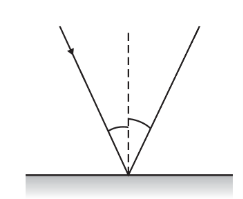
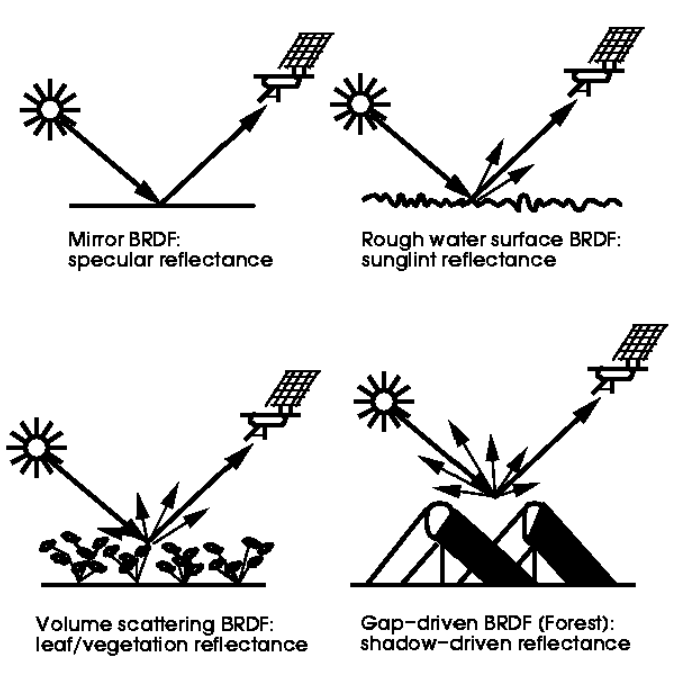
- Reflection depends: The surface roughness relative to the wavelength of the incident radiation.
- Angle of incidence is the surface roughness
Specular Reflection
|
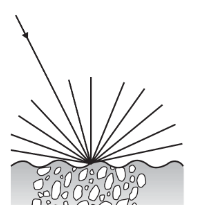
Diffuse Reflection
|
|---|---|
|
|
Reflectance Characteristics
| Vegetation | Bare SOIL | Water | |
|---|---|---|---|
| Depending factors |
Dependent factors
Application:
|
|
lower reflectance |
| Reflects |
|
|
|
| Incident energy Reflection | Vegetation may reflect up to 50% | soils up to 30–40% | water reflects at most 10% |
| Energy Absorbed |
|
|
Beyond 1.2 μm |
| Examples |
|
|
BRDF The Bidirectional Reflectance Distribution Function: It gives the reflectance of a target as a function of illumination geometry and viewing geometry. It depends on:
- Wavelength
- Determined by the structural and optical properties of the surface,
- shadow-casting, multiple scattering, mutual shadowing, transmission, reflection, absorption, and emission by surface elements, facet orientation distribution, and facet density.
more: umb
Sensors
Remote sensor
- Device that detects EM energy
- Quantifies + records EM energy IN analogue or digital way

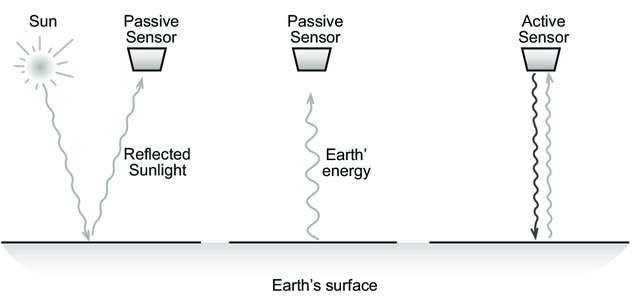
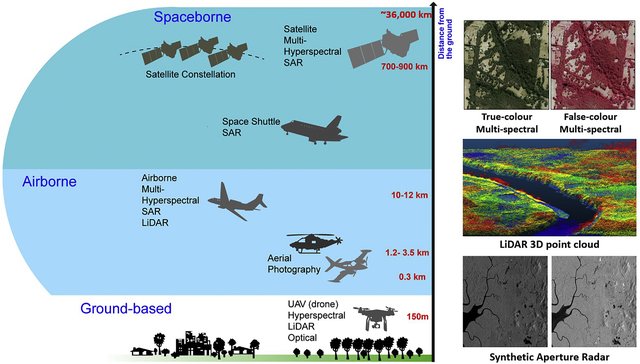
Image: Common Remote-Sensing Platform and Sensor Combinations and Remote-Sensing Data. (Left) Platforms and most commonly utilized sensors for specific platforms. (Right) True-color digital aerial photography and false color with NIR sensing (top), LiDAR point cloud of vegetation near a river (middle), and SAR data for two polarizations from Sentinel 1 (bottom).
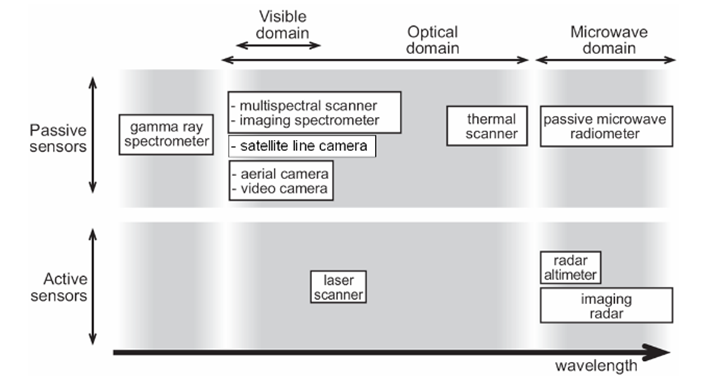
| Active | Passive |
|---|---|
| Use their own source of energy | Do not have their own source of energy |
| Independent of solar radiation | Sun/ solar energy , Earth heat emission or detect naturally occurring radiation |
Mostly works in microwave regions of EMR spectrum.
|
Record electromagnetic energy
|
| Can choose any radiation from EM spectrum | Detect reflected or emitted radiation: ultraviolet to the thermal infrared |
| an all weather, day-night system | It depends upon good weather conditions |
| It uses both transmitter and receiver units to produce imagery | Relatively simple both mechanically and electrically |
| requires high energy levels | does not have high power requirement |
| Relatively independent of atmospheric scatterings | |
RADAR signal
|
wavebands, where natural remittance or reflected levels are low high detector sensitivities and wide radiation collection apertures are necessary to obtain a reasonable signal level. most passive sensors are relatively wide band systems |
|
|
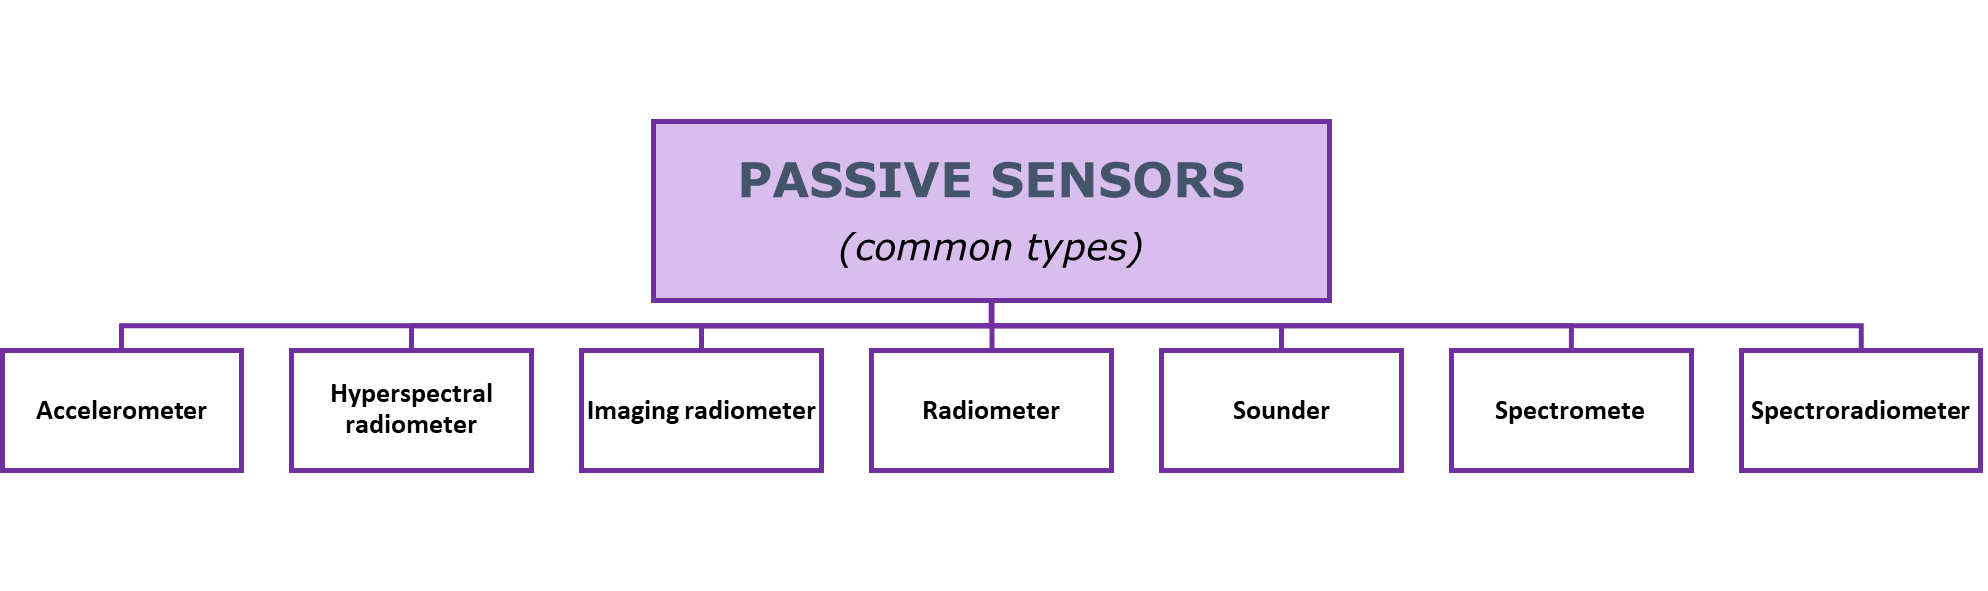
| Types: Laser altimeter, scanning electron microscopes, LiDAR, radar, GPS, x-ray, sonar, infrared and seismic (exist in both active and passive forms) | Devices Eg: Spectrometer, Radiometer, Spectroradiometer, Hyperspectral radiometer, Imaging radiometer, Sounder, Accelerometer |
| Mounted to a satellite, an airplane, a boat, building top or a submarine UAV drone | |
| Application: cartography to resource exploration to atmospheric and chemical measurements Application: agriculturalists and foresters, marine sciences and rescue missions, weather forecast etc. | |
Radar:
Lidar:
Laser Altimeter:
|
more on senors: earthdata
Active Sensors

Spatial resolution of radar data~ ratio of the sensor wavelength to the length of the sensor’s antenna
- Meaning: for a given wavelength
- Longer antenna = higher spatial resolution
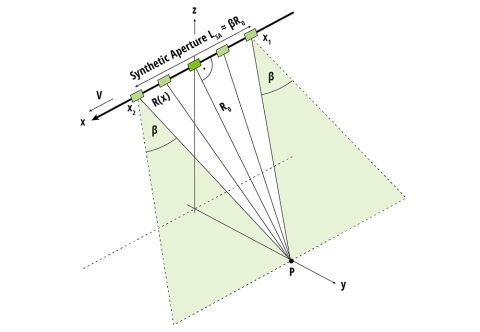
SAR
- Synthetic aperture radar (SAR)
- sensor produces its own energy
- active data collection
- can see through night, any weather condition
- wavelength: micorwaves
- A series of shorter antenna is combined to simulate a larger antenna
- Result: higher resolution
SOURCE: earthdata
- Radar sensors utilize longer wavelengths at the centimetre to meter scale
- Helps: ability to see through clouds
- Produces: fine-resolution images from a resolution-limited radar system
- radar movement: straight line
- carrier: airplane or NISAR
- NISAR
- provide multiple polarization modes across its two radar bands
- 24 cm wavelength L-SAR
- 10 cm wavelength S-SAR.
- How?
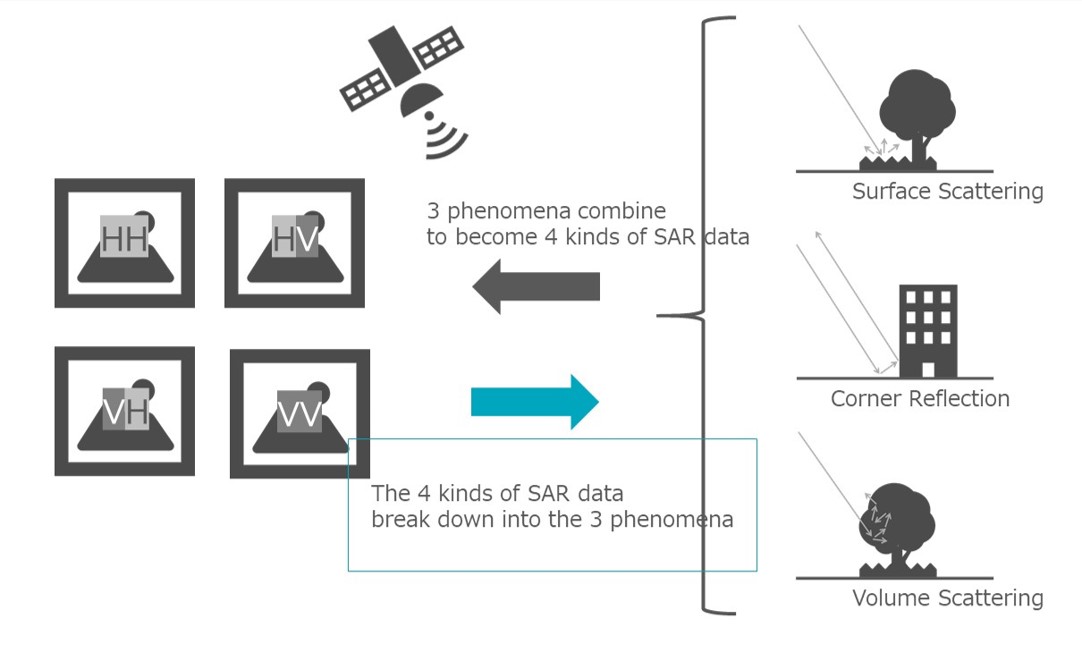
- transmits microwave signals>earth surface>receives back the signals (backscattered)> sensor makes an image from returned echoes- bat flying in cave
- Result imaginary built?
- Wavelength strength and time delay of the returned signal
- depends primarily on the
- roughness and electrical conducting properties of the observed surface
- its distance from the orbiting radar
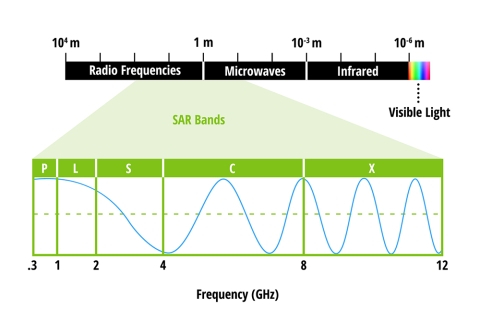
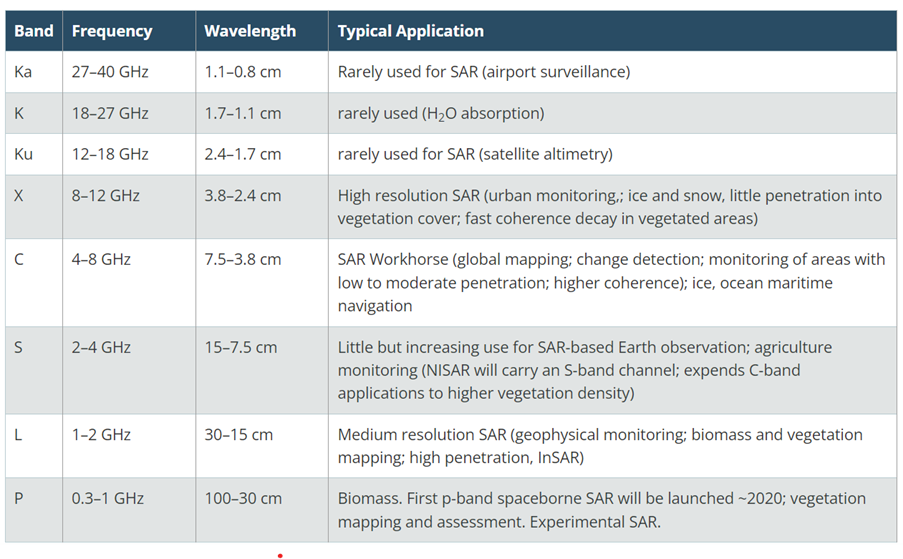
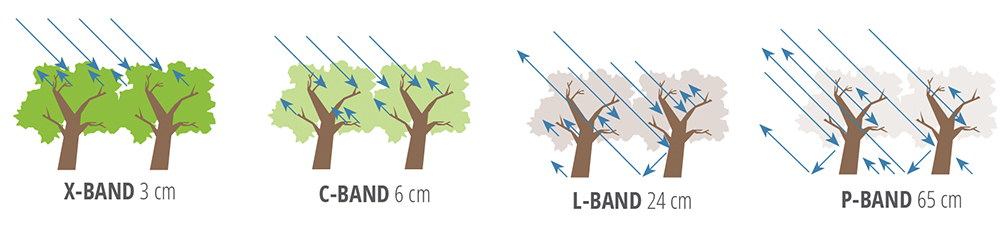
- SAR has different wavelengths = bands
- Bands: X,C,L,P
- Important feature to consider
- Wavelength determines
- How far a signal can penetrate into the medium
- How the signal interacts with the surface
- To understand look at X an L bands below
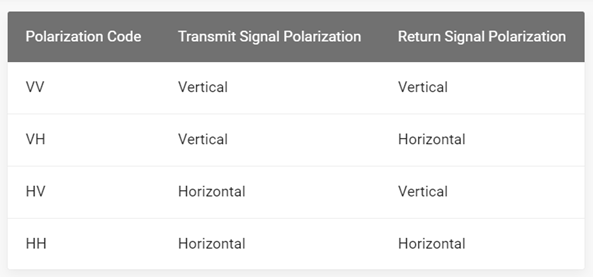
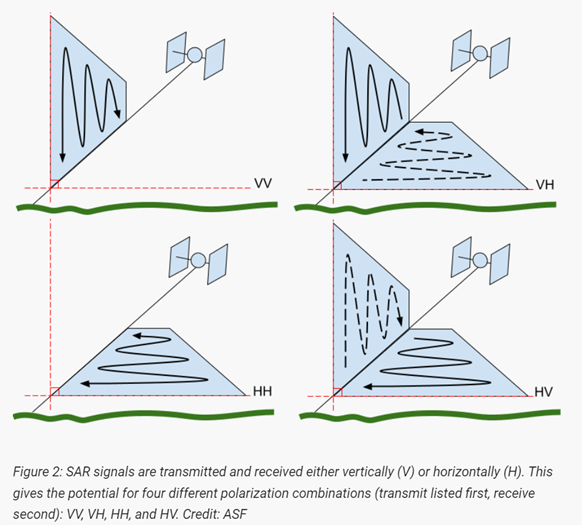
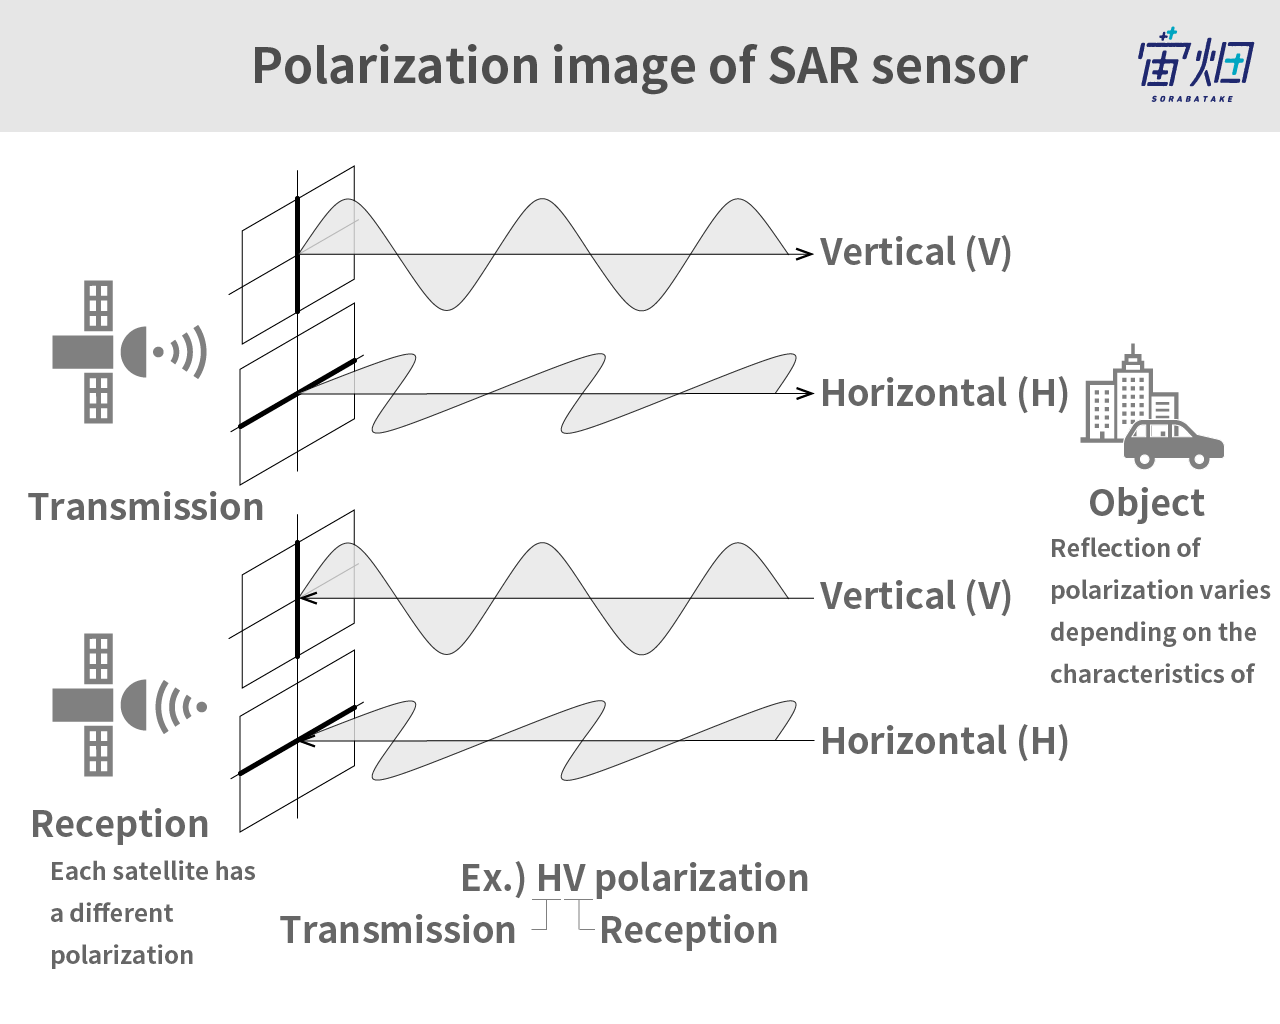
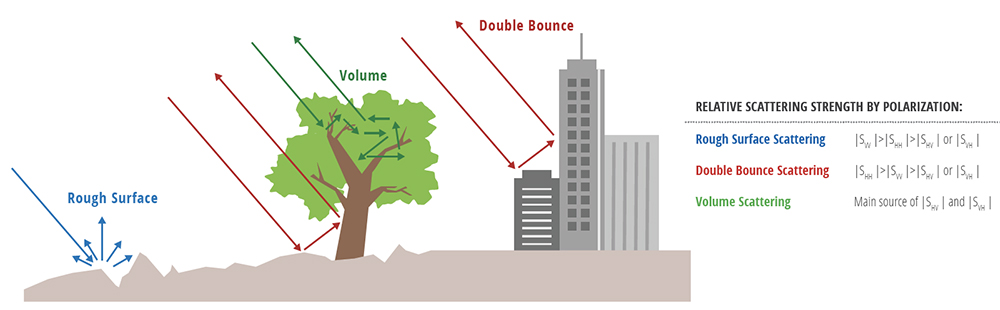
- Polarization: orientation of the plane in which the transmitted electromagnetic wave oscillates
- SAR=typically transmit linearly polarized
- Signal polarization can be precisely controlled on both transmit and receive
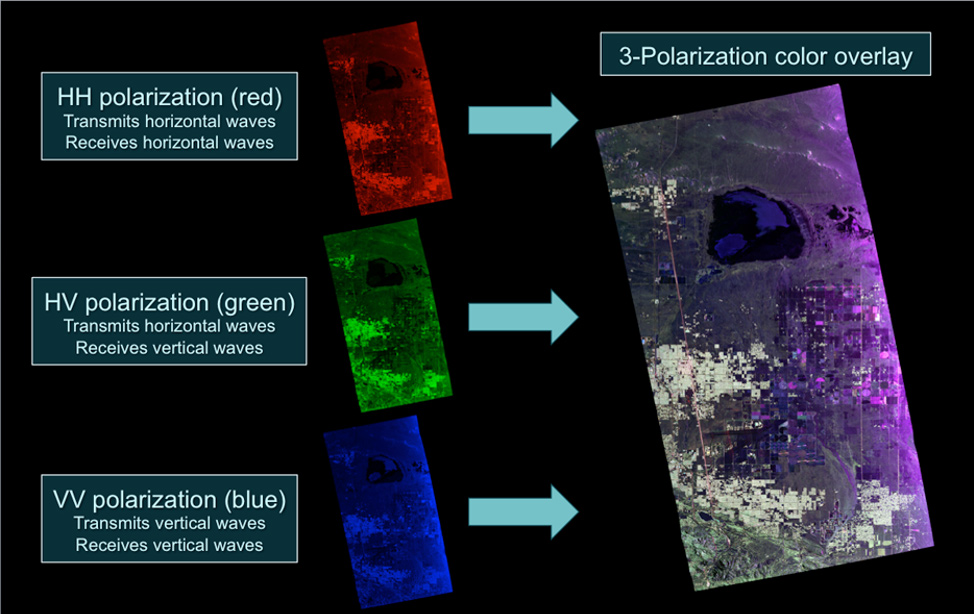
- Horizontal polarization = H
- Vertical polarization = V
- Signals
- polarizations carries information about the structure of the imaged surface
| Scattering | Surface | Emitted+ Recieved |
|---|---|---|
| Rough Surface scattering | bare soil or water | VV Scattering |
| Volume Scattering | leaves and branches in a forest canopy | VH or HV (cross-polarization) |
| Double bounce Scattering | buildings, tree trunks, or inundated vegetation | HH polarized |
- Interferometry (InSAR) – analysis method
- Uses: uses the phase information recorded
- Measures: distance from the sensor to the target
- Measurement= very accurate
- to measure changes in land surface topography??
- Observations= Atleast 2 of the same target
- Sensor data= Distance + additional geometric information
- Application:
- identify areas of deformation from events like volcanic eruptions and earthquakes
- SAR data limitations:
- Tedious preprocessing steps (applying the orbit file, radiometric calibration, de-bursting, multilooking, speckle filtering, and terrain correction) earthdata
- Sensors: earthdata
- SAR distortion: alaska.edu
- SAR Hand book: ntrs
- Interferometry: nisar
- SweepSAR: nisar
Passive Sensors
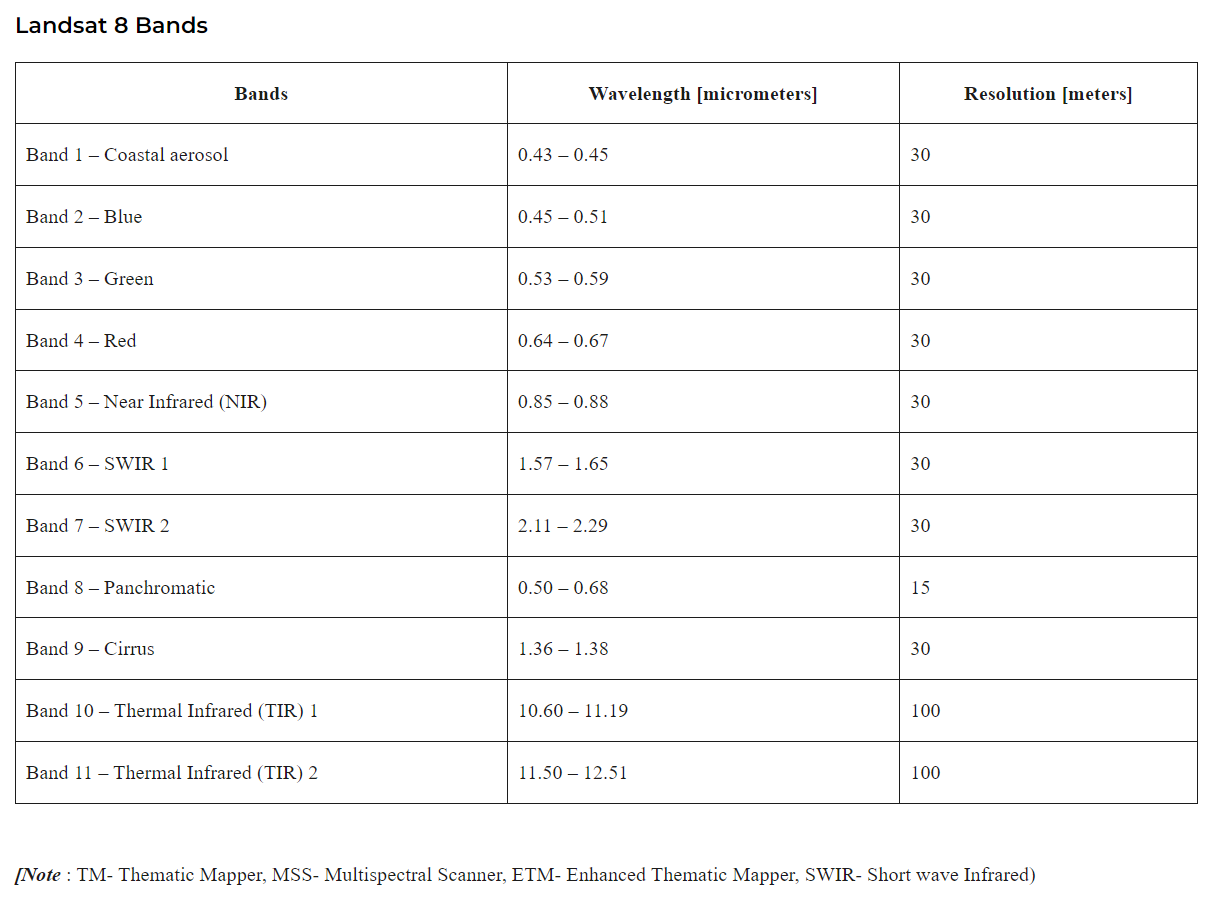
Example: LANDSAT 8

So now we have an idea on how sensors work. But how do SENSORS STORE INFORMATION???
- Data received is translated => Digital Image (can be displayed on digital screen)
- What is this digital image???
NOISE
in remote sensing
- REMOTE SENSING> Frequency band - any disturbance
- DATA QUALITY> - Transmission Signal - Any irregular, sporadic, or random oscillation
- TELECOMMUNICATIONS> communication - interfering random or repetitive events
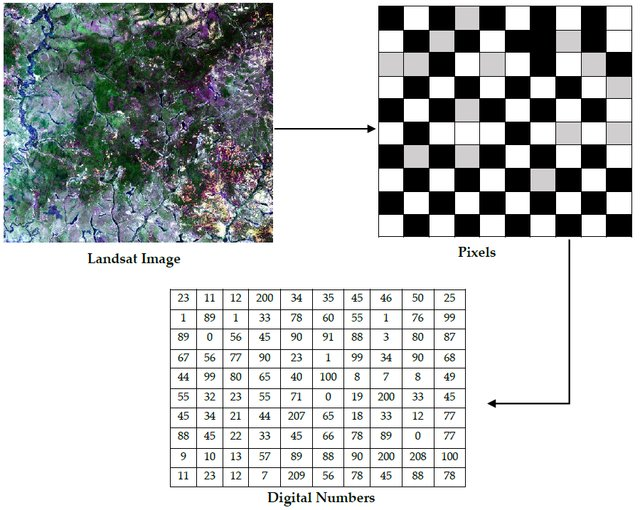
Digital Image
2 dimensional array of pixels
![]()
![]()
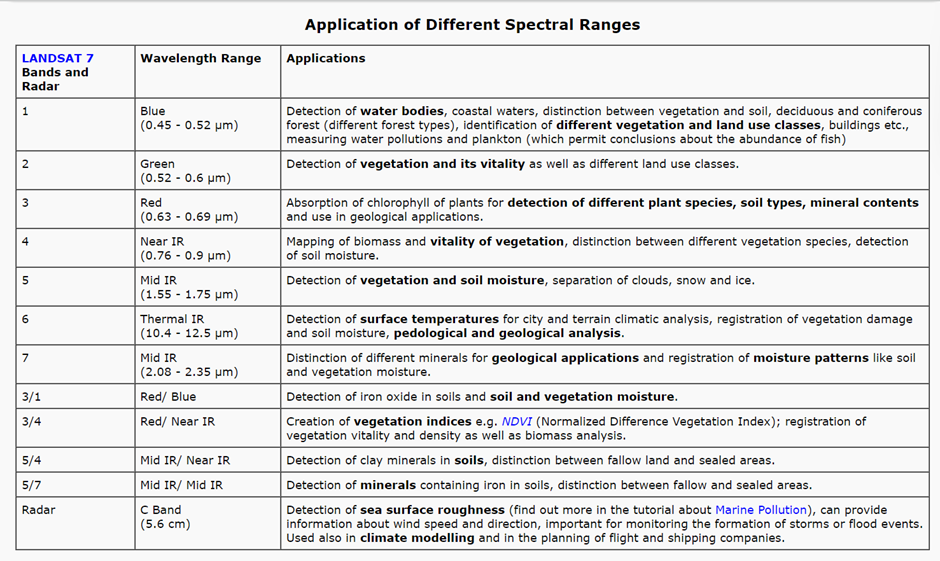
Bands
- bands is a set of data file values
- FOR?? a specific portion of the Electromagnetic spectrum (reflected light or emitted heat).
- Bands; red, green, blue, near-infrared, thermal infrared (we covered it above)
- bands> GIS > bands= layers - Additional layers can be created and added to the image file.”
Multispectral image:
- Each band of a multispectral image >
- Displayed:
- One band at a time as a grey scale image OR
- Combination of three bands at a time as a color composite image
PIXEL
- The tiny Squares 🟥🟧- look at the image above (Just think of your phone’s Camera image)
- Unit of image = pixel (Picture Elements)
- Represent the relative reflected light energy recorded for that part of the image
- Each pixel= square area on an image
- Square area of an image= measure of the sensor’s ability
- Ability of what??
- To see objects of different sizes
- Each pixel has intensity value and Location address
- Intensity value - represented as? Digital Number
- Location address - row and column numbers
- So how does the computer that receives it know which part of the image should be dark and light?
- Binary Numbers!!
- 0s and 1s= on-off switch _(cos computers like it that way!! we don’t want it to be fussy- i’ts an inclusive approach)_
- How does this happen??
- converting decimal system => Binary System
- 00=0
- 01=1
- 10=2
- 11=3
- OKay so assigning is done…but now is 00 the darkest or 11??? (see the image below-
- 00 = Darkest = black=⚫
- 11= brightest = white = 💡
- The issue: as the image above it would create image with High CONTRAST…..SO?
- Sapcecraft uses a string 8-bit data (there can be
- 8 bit= 8 binary numbers= 00000000
- Think of it as creating a gradient or adding more white color to your black gradually until u make your black white…get it? or adding more and more milk into your coffee, untill u dont taste coffee.
- Range in binary: 00000000 to 11111111
- in decimal system; 0 to 255
- so in spacecraft which is the darkest?? its the Same, just more numbers.
- 00000000 = darkest ⚫
- 11111111 = brightest 💡
- SO? what next???
- This entire set is sent back from spacecraft….
- binary numbers (btw 0-255)
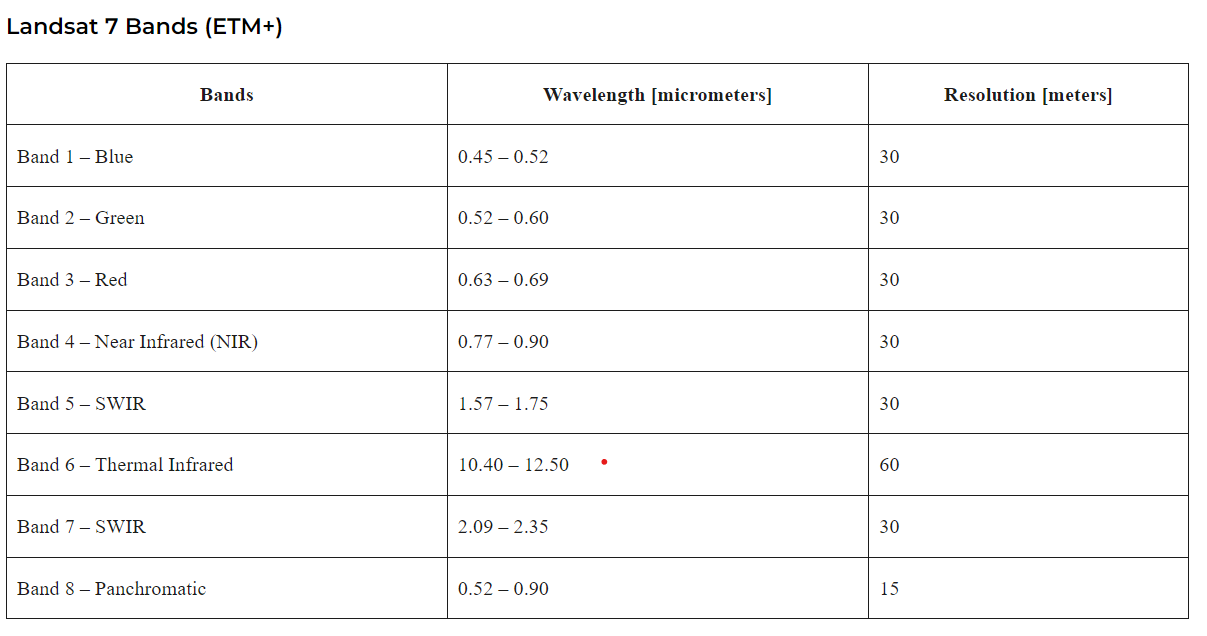
- Eg: Landsat 7 🛰️
- Sensor〰️ ✴️ : Enhanced Thematic Mapper (ETM+)
- Bands: 8 band whiskbroom scanning radiometer
- Maximum Resolution: 15 meters
- Pixel (Each):
- area: area 15 m x 15 m
- pixel1 + pixel2 + pixel3…..n = Area
- Example: false image> count number of green pixels= vegetation area
- ⬆️Resolution = ⬆️ Pixel Resolution
- Sensor= ⬆️Resolution = detect SMALL objects 👁️

Summary of this section, below image is just indicative
![]()
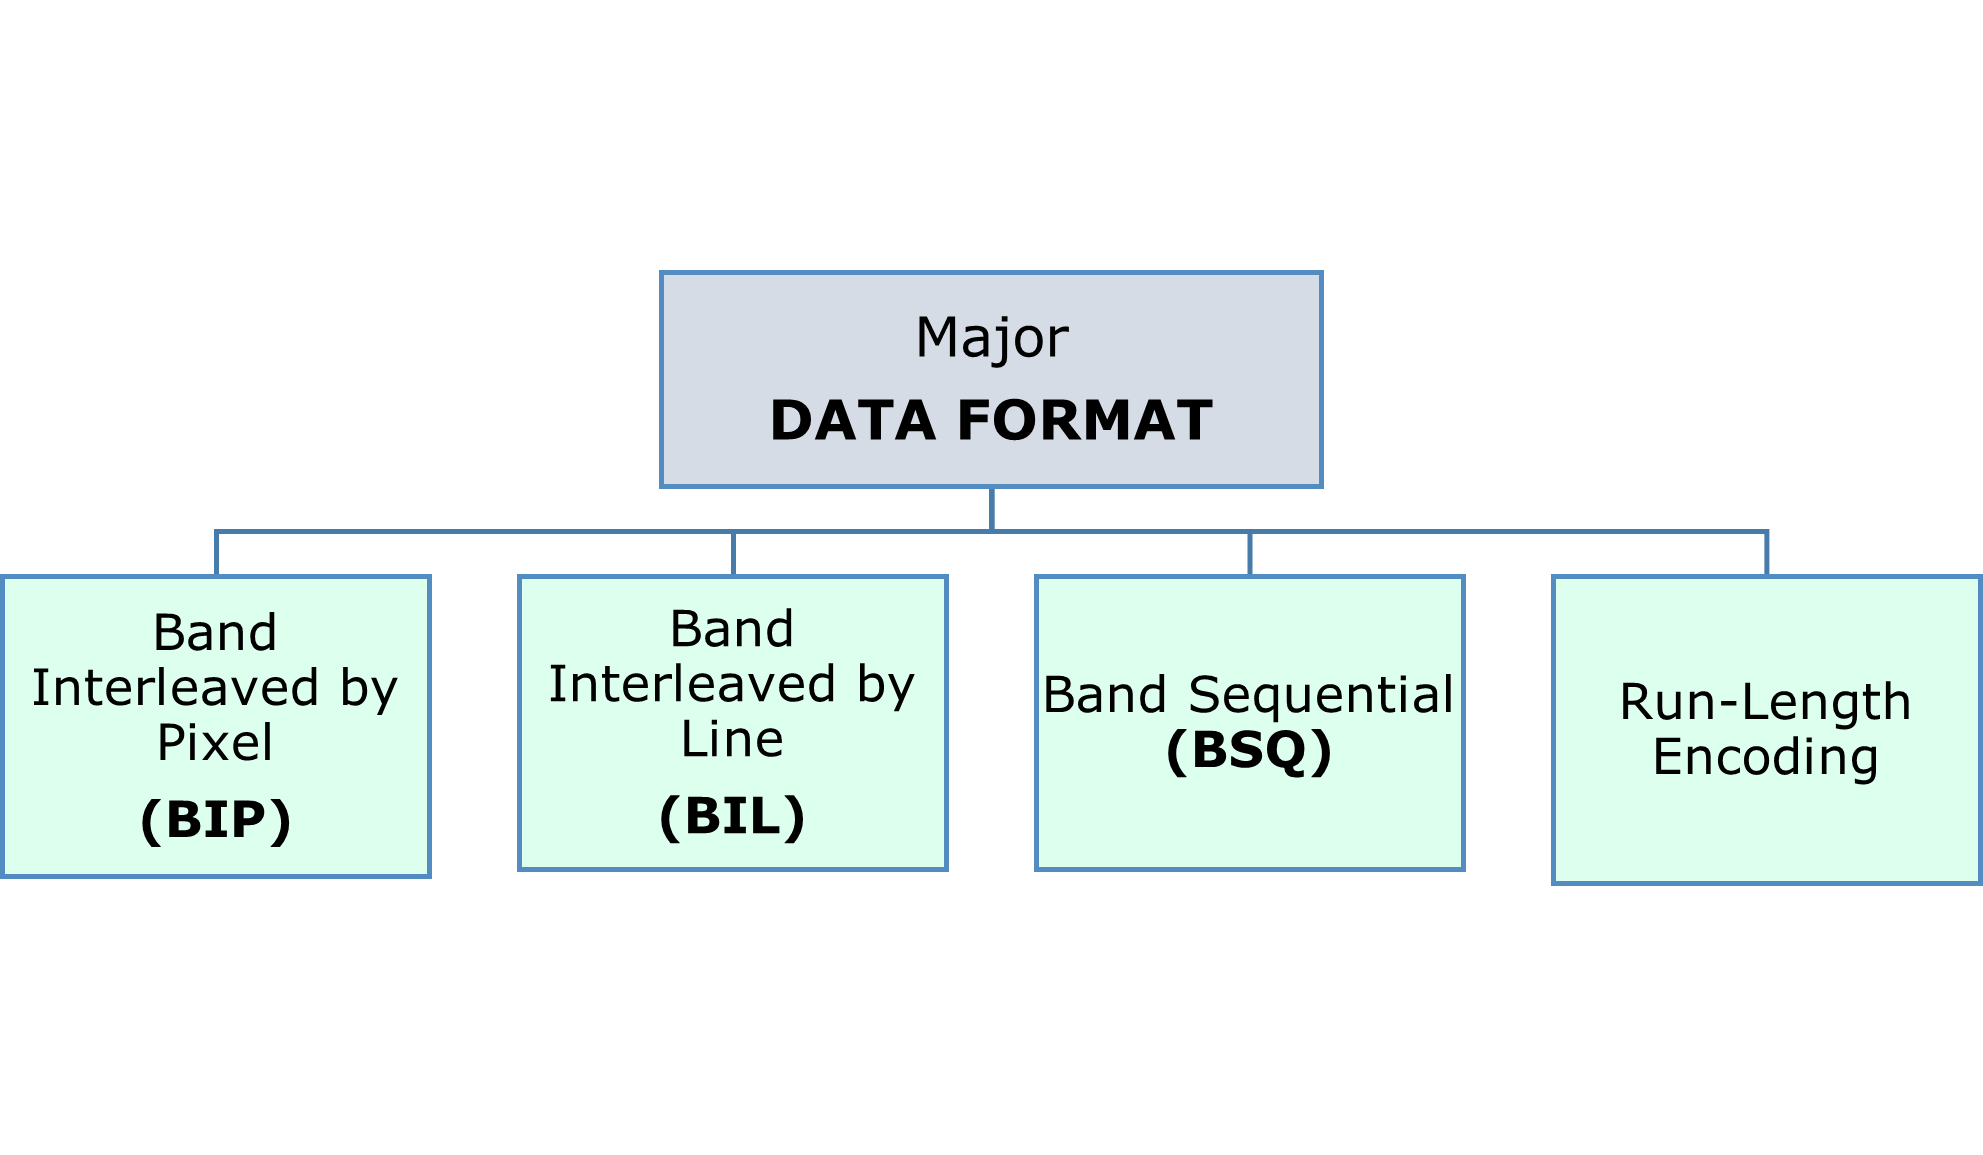
SO next question, what format is it stored in??
Data Format
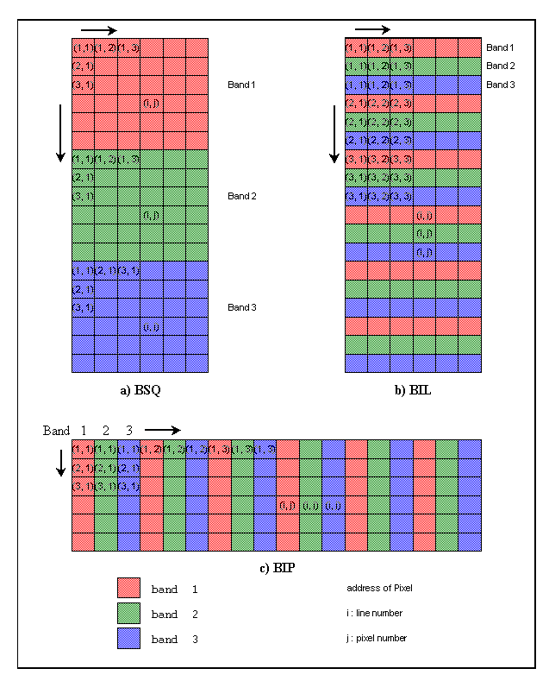
other sources: gisgeography., e-education.psu, sar.kangwon
Resolutions
By now let us just accept that every word in remote sensing branches out and even has aerial roots like a banyan tree. So just accept it, its a long journey.
- Measure of sensor ability to distinguish between signals
- Information in RS= dependent on Resolution
- role: how data from one sensor can be used
- helps understand what type of data is required for a given study
- 4 types of resolution for data set
4 RESOLUTIONS
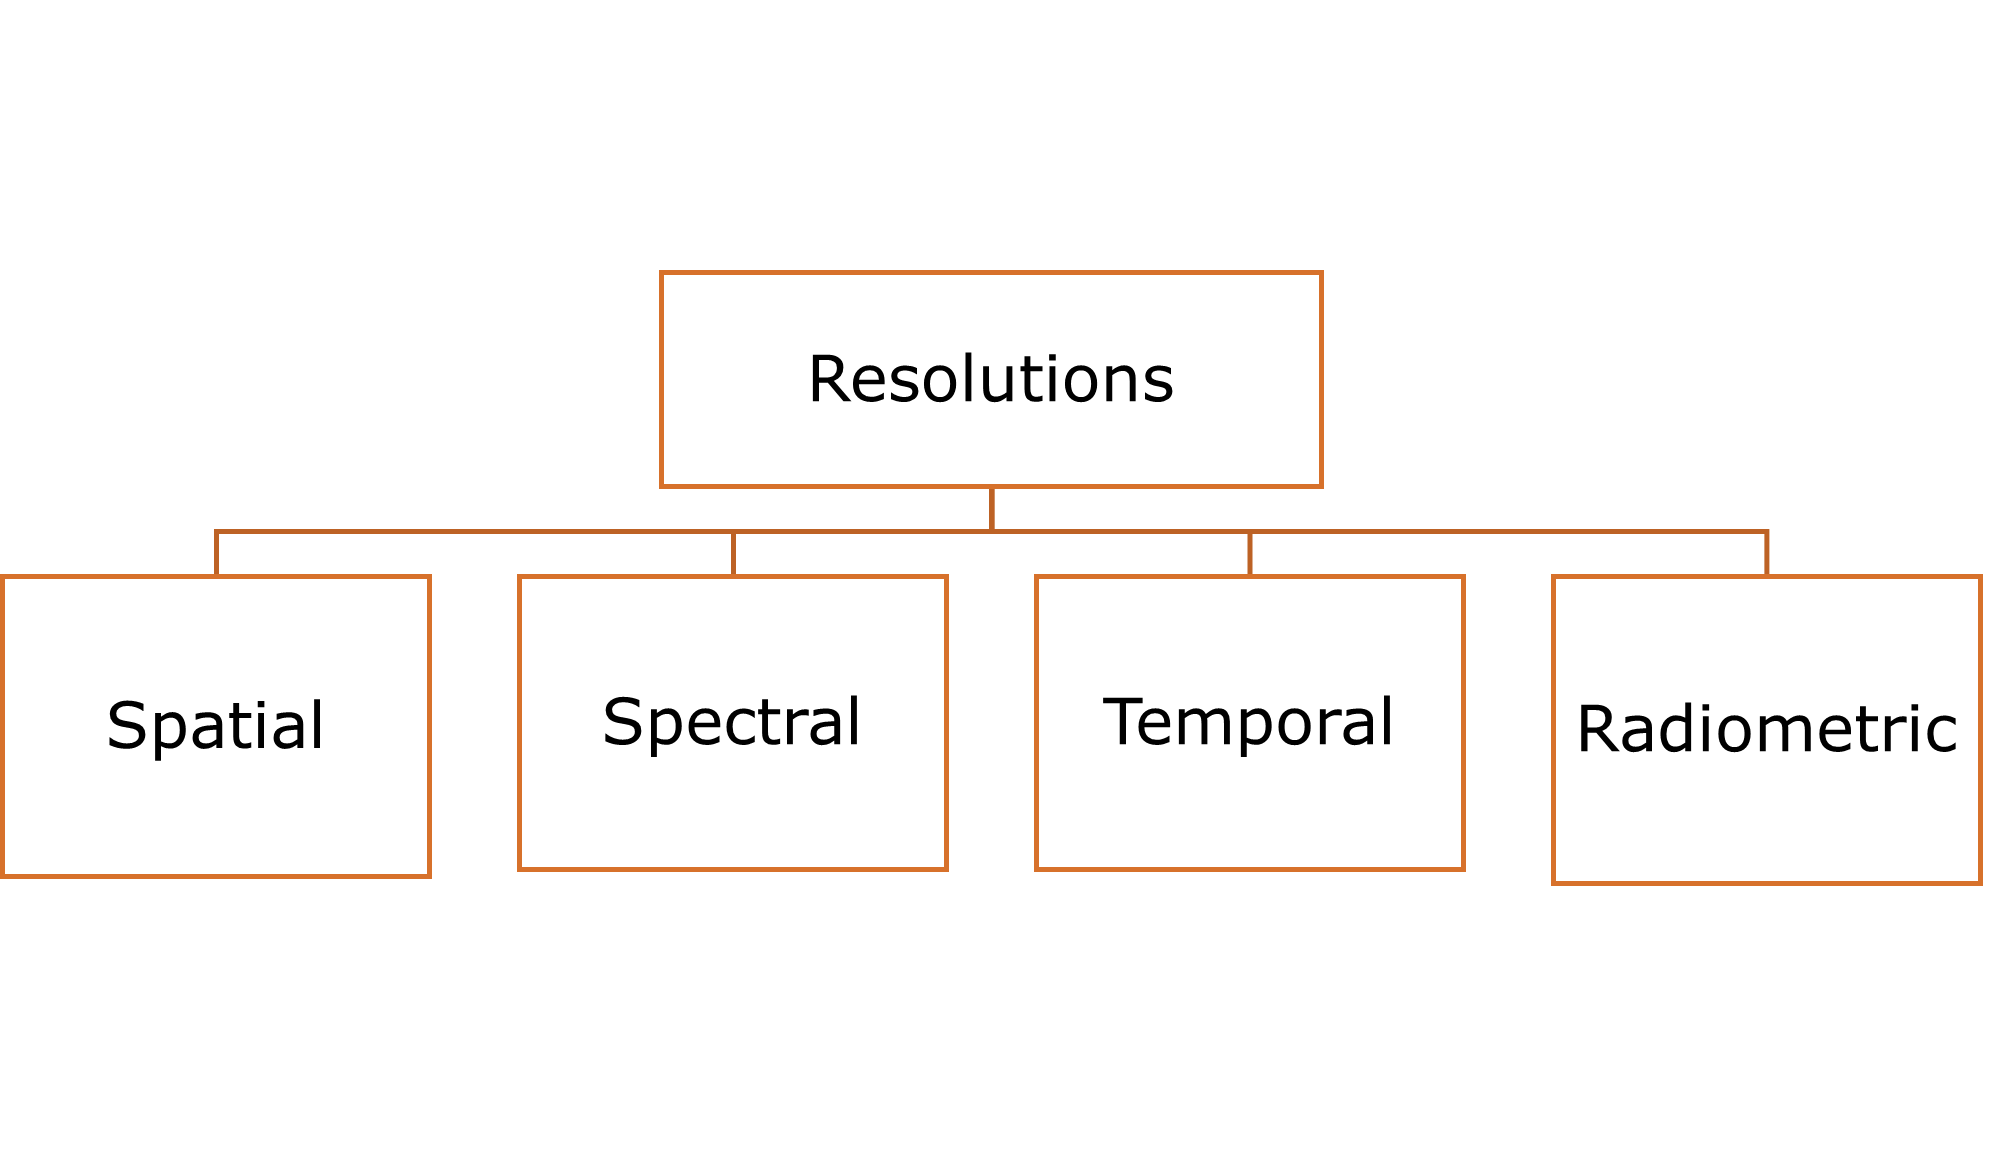
| Spatial Resolution | Spectral Resolution | Radiometric Resolution | Temporal Resolution |
|---|---|---|---|
| Size of the smallest object that can be detected in an image | Number of bands + wavelength width of each band | sensitivity of a remote sensor to variations in the reflectance levels | how often a remote sensing platform can provide coverage of an area |
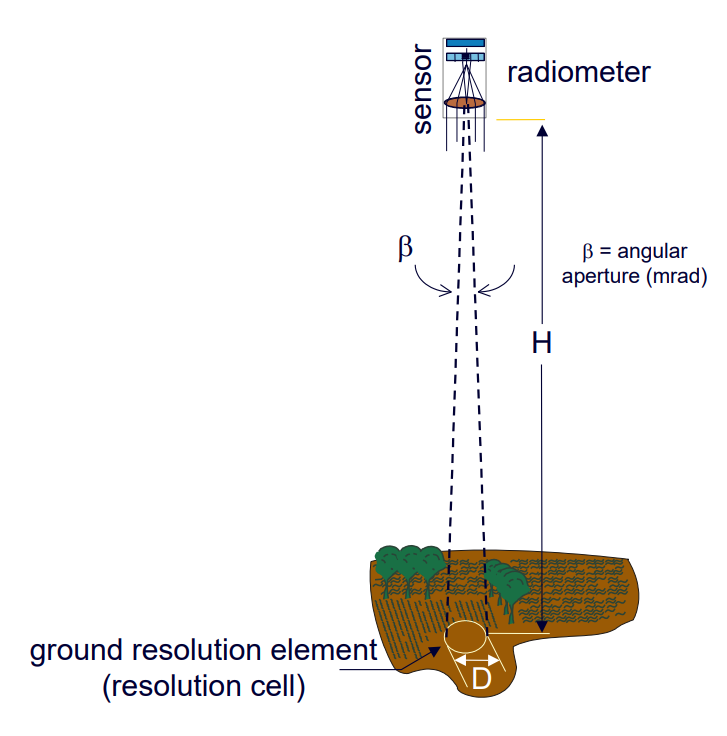
Spatial Resolution
size of the smallest object that can be detected in an image
- size of smallest object
- unit of image= pixel
- 1 m spatial resolution= each pixel image~reprsents an area of 1 sqm (1x1)
![]()
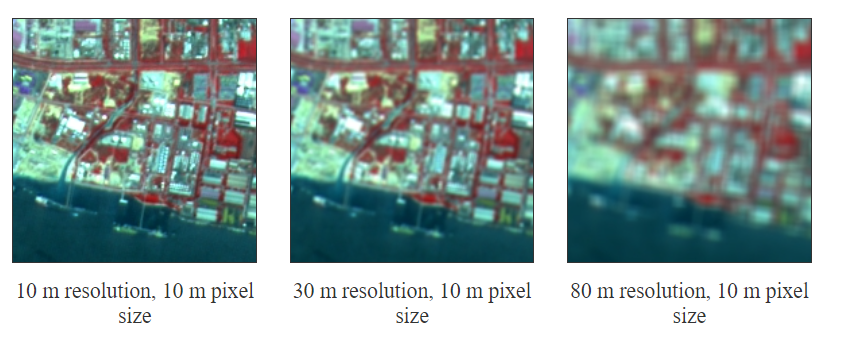
Spatial Resolution
| High Resolution Use | Medium Resolution Use | Low Resolution Use |
|---|---|---|
| Extreme precision | Not extreme precision | Lack of precision |
|
|
|
|
|
|
Spectral Resolution
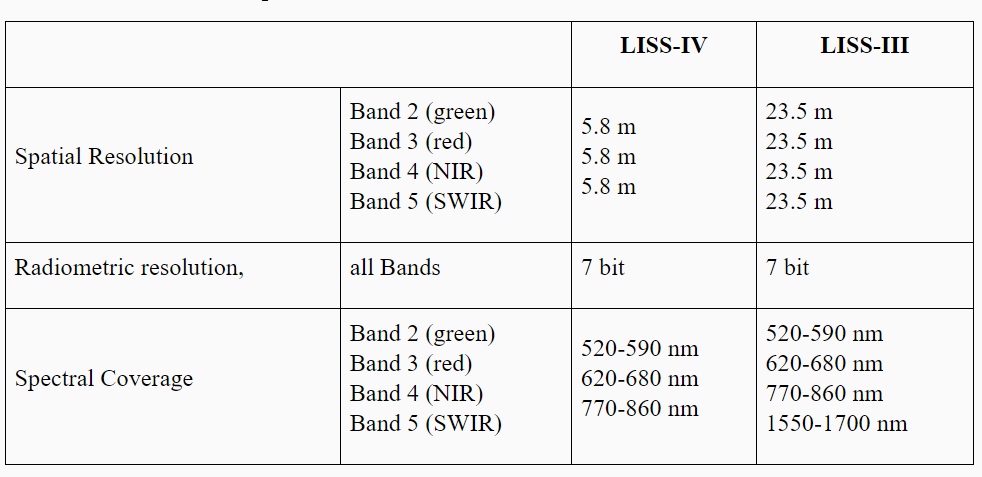
Number of bands + wavelength width of each band
- BAND= narrow portion of the electromagnetic spectrum
- short wavelength width= HIGHER resolution
- Multi-spectral imagery
- measure: several wavelength bands (example: visible green or NIR)
- Multi-spectral sensors: Landsat, Quickbird and Spot satellites
- Hyperspectral imagery:
- measures: energy in narrower and more numerous bands
- more sensitive to variations in energy wavelengths = greater potential
- Eg: used to check crop stress
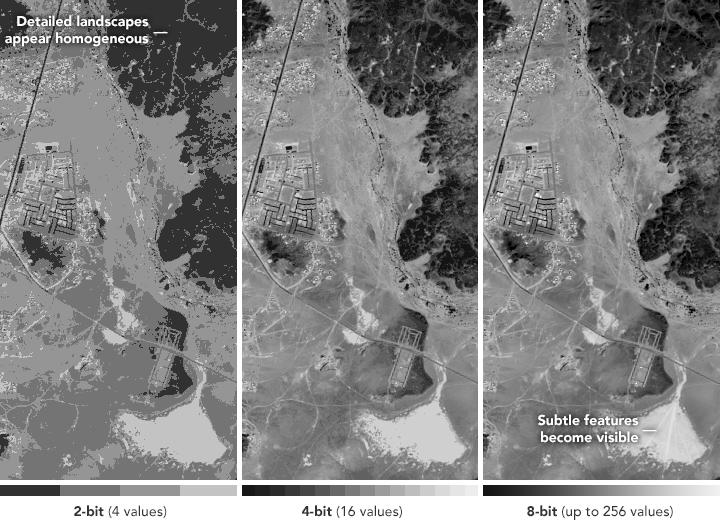
Radiometric Resolution
Amount of information in each pixel!!
- sensitivity of a remote sensor to variations in the reflectance levels
- Information form? BIT= energy recorded
- ⬆️Higher radiometric resolution = ⬆️more sensitive = ⬆️more precise picture (a specific portion of the electromagnetic spectrum)=
- Sensitive how? - detecting small differences in reflectance values
- small differences how? - ⬆️ more values stored= ⬆️ detecting btw slightest differnce of energy
- How is the information recorded/ stored?
- in the bit for an exponet of 2
- eg: 8 bit = 2^8 resolution = 256 potential digital values (refer example above)
- Application: water quality: distinguish btw subtle difference in ocen color
Temporal Resolution
Satellite to complete an orbit and revisit the same observation area
- how often a remote sensing platform can provide coverage of an area
- Geo-stationary satellites = provide continuous sensing
- eg cameras mounted on Airplanes = provide data for applications requiring more frequent sensing
- Remote sensors located: fields or attached to agricultural equipment >> most frequent temporal resolution
- normal orbiting satellites = provide data each time they pass over an area
- Issues: cloud cover
- eg: Polar orbiting satellites: temporal resolution = 1-16 days
- MODIS sensor: resolution of 1-2 days- daily changes
- OLI: narrow swath width: resolution of 16 days= bi-monthly changes= high spatial resolution
- high spatial resolution = narrower swath = molre time = low temporal resolution
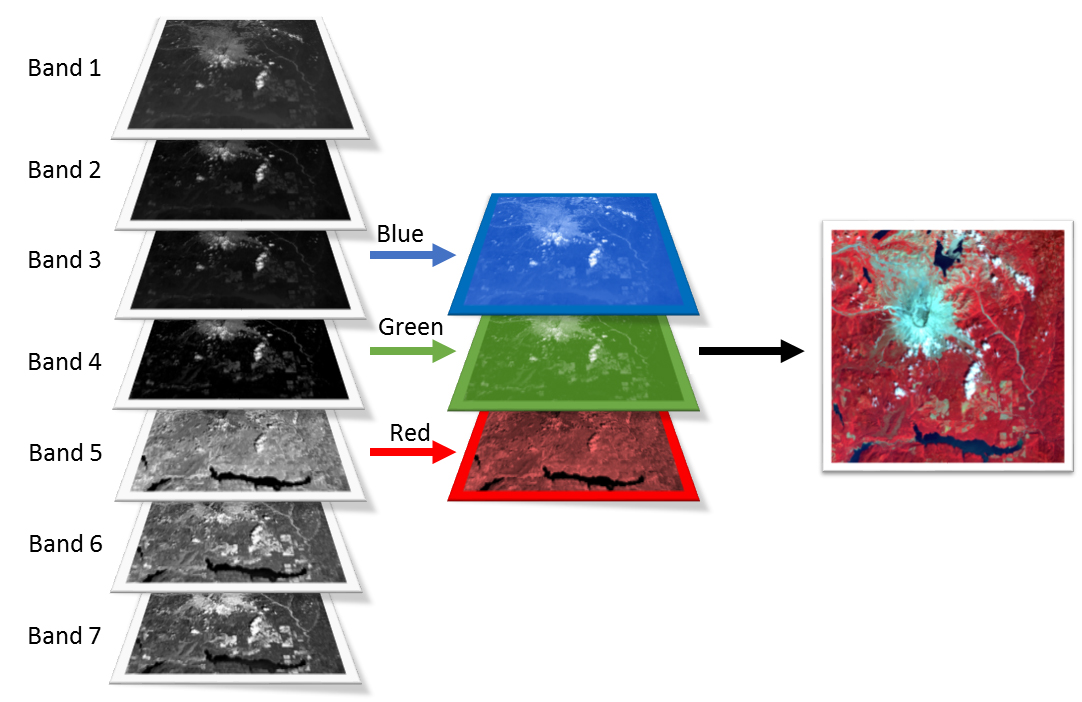
Multilayer Images
- Of a certain area/ one particular areaI on ground
- multiple measurements
- each measurement forms an image (carries specific information)
- STACKING these images = MULTILAYER IMAGE
- MULTIPLELAYER image formation: (combination of)
- same
- different sensors
- subsidiary data
- Combination eg:
- 3 layers = SPOT
- 1 layer = ERS (synthetic aperture radar)
- 1 layer = digital elevation map
- For Healthy vegetation (Infra-red> into Red band, red into> gree band, and then gree into Blue band. Blue band is omitted as it reflects too much light an dis not useful. RESULT IMAGE: would show vegetation as red (if its healthy)
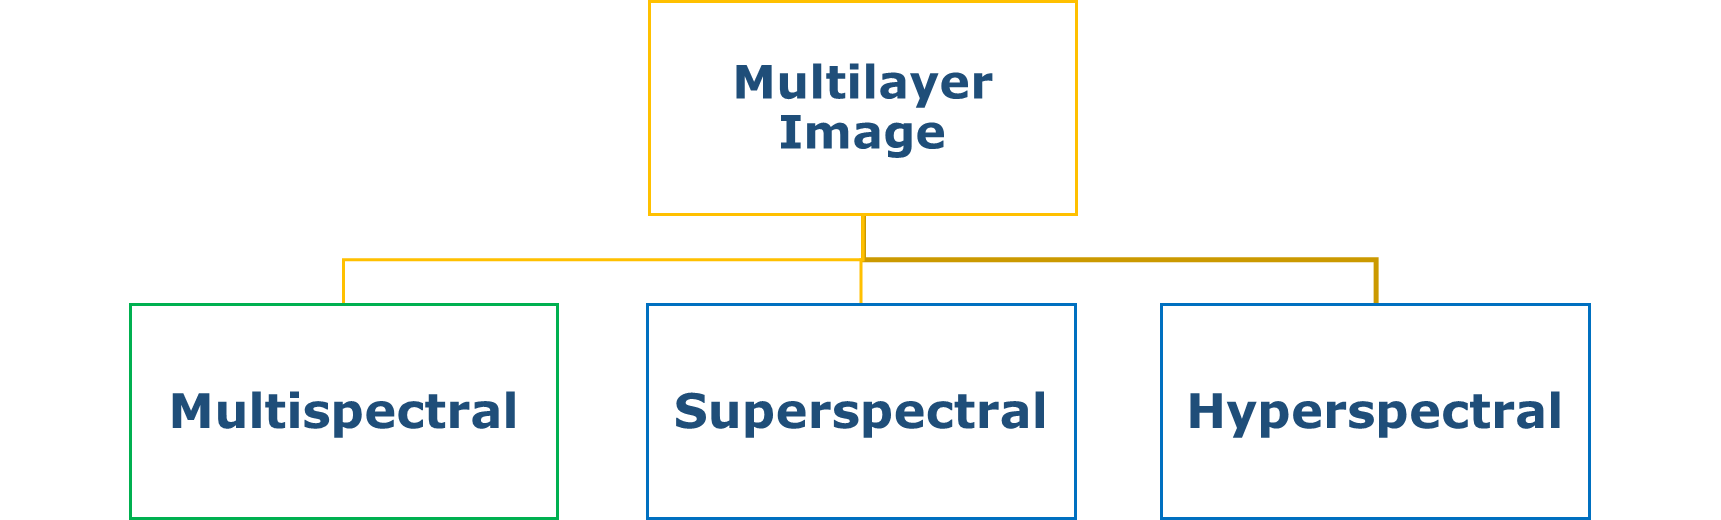
Multispectral Image
- few layers
- image from a particular wavelength band
- Eg:
- Sensors:
- SPOT & HRV
- three wavelength bands
- green (500 - 590 nm)
- red (610 - 680 nm)
- near infrared (790 - 890 nm)
- meaning: each pixel= three intensity value= corr to 3 bands
- three wavelength bands
- IKONOS
- 4 bands: Blue, Green, Red and Near Infrared
- LANDSAT
- 7 Bands: blue, green, red, near-IR bands, two SWIR bands, and a thermal IR band
- SPOT & HRV
- Sensors:
Superspectral Image
- more wavelength bands
- Sensor:
- MODIS
- 36 spectral bands: visible, near infrared, short-wave infrared to the thermal infrared
- MODIS
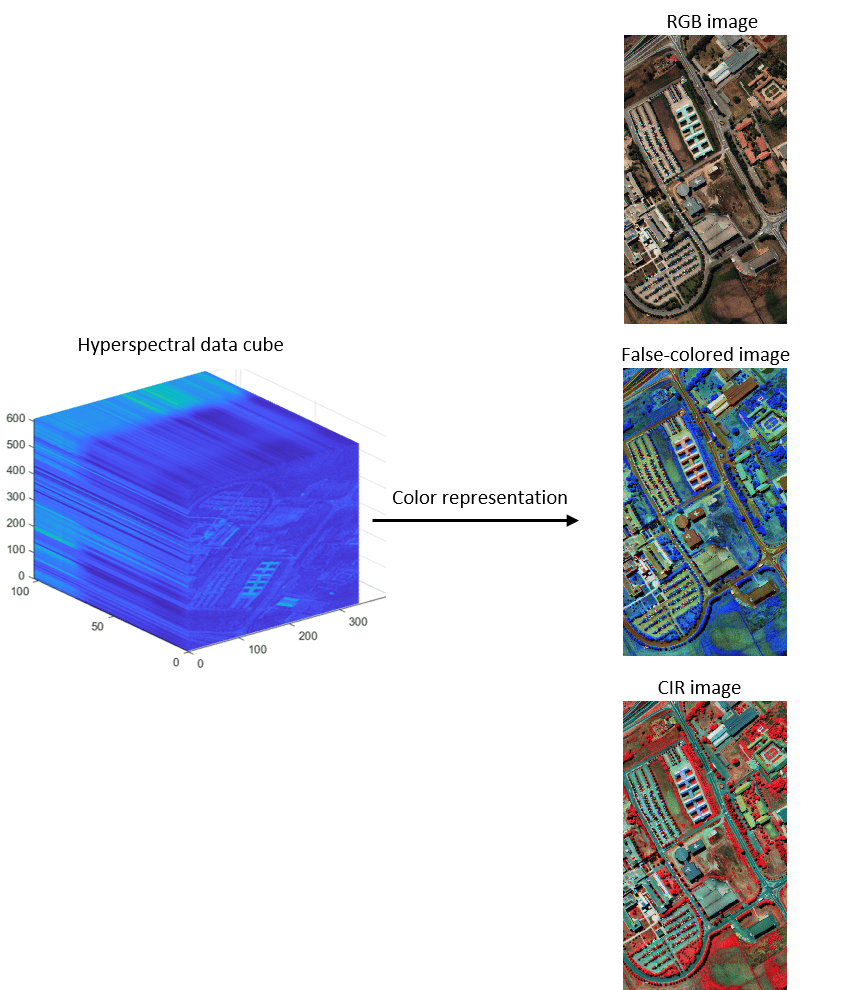
Hyperspectral Image processing
- Based on taking a fraction of the electromagnetic spectrum> breaking it into numerous bands for theoretical analysis and computations.
- Why do it?
- One can detect and identify objects more precisely compared to using only three bands information provided by a RGB camera.
- not commercially available, only scientific investigation
- 100+ contiguous spectral bands.
- characteristic spectrum of the target pixel is acquired in a hyperspectral image
- precise spectral information
- enables better characterisation
- better identification of targets
- Application:
- precision agriculture (crop: health, moisture status and maturity)
- coastal management ( phytoplanktons, pollution, bathymetry changes)
- EOI satellite
- Sensor:
- CHRIS: ESA’SPRABO satellite
![]()
Application
- The above segments explain the extent of the Remote Sensing application.
- Data Extracted application (just a few):
- Forest fires
- Pollution
- Volcanic eruption
- Flooding
- Weather
- Crop growth
- Carbon sinks
- Forest covers
- City Growth
- Ocean floor
Reflection
- How to approach the subject initially to understand the concepts?--- overwhelming resources, so stick to three good resources (combination of books or webpage) and don’t deviate.
- The entire process is about measuring and understanding reflected and emitted radiation.
- It is essential to understand how EM waves and frequency work. It is like EMW has a life of its everything it interacts with has some effect.
- Sensors are on-boarded on a satellite (active and passive)
- Multiple pixels make a band, where information is stored in a bit. The higher the bit meaning more information leading to better detection of features.
- Each band has a set of information Multiple bands with different information are stacked on each other to form an image. (can be a combination of various satellites)
- It is interesting to see how much is observed and accomplished through remote sensing.
- It is essential to understand which scale data is required and for what use/ size of the target is to be resolved, based on which the specific satellite data is to be acquired. Eg. If I need to find data to count the number of cars parked in a parking lot, I won’t use Landsat imagery as it is (30mx30m). Solution: Maxar or planet.com (3mx3m)
- Whatever is to be detected through remote sensing needs to be twice the size of your pixel.
- Cadence: Landset-16days (40-year time period), sentinel 2-10 days (equator) and 2-3 (mid-latitude) (10mx10m) pixel == it is amazing so many questions can be resolved in a short duration of time.
- How to approach the subject initially to understand the concepts?--- overwhelming resources, so stick to three good resources (combination of books or webpage) and don’t deviate.
- The entire process is about measuring and understanding reflected and emitted radiation.
- It is essential to understand how EM waves and frequency work. It is like EMW has a life of its own everything it interacts with has some effect.
- Sensors are on-boarded on a satellite (active and passive)
- Multiple pixels make a band, where information is stored in a bit. The higher the bit meaning more information leading to better detection of features.
- Each band has a set of information Multiple bands with different information are stacked on each other to form an image. (can be a combination of various satellites)
- It is interesting to see how much is observed and accomplished through remote sensing.
- Its is essential to understand which scale data is required and for what use/ size of target that is to be resolved, based on which the specific satellite data is to be accuired. Eg. If I need to find data to count the number of cars parked in a parking lot, I wont use Landsat imagery as it is (30mx30m). Solution: Maxar or planet.com (3mx3m)
- what ever needs to be detected through remote sensing need to be twice the size of your pixel.
- Cadence: Landset-16days (40 year time period), sentinel 2-10days(equator) and 2-3 (mid latitude) (10mx10m) pixel == its amazing, so many questions can be resolved in short duration of time.