class: center, middle, inverse, title-slide .title[ # Sensor ] .subtitle[ ## MODIS ] .author[ ### Diana Mathai ] --- class: inverse, right, corner background-image: url(https://dhvptdf78rzwk.cloudfront.net/01384/00409/d279f2/Aqua-modis.fullscreen.jpg) background-size: cover background-position: contained # **MODIS** ### Moderate Resolution Imaging Spectroradiometer .left[Source:imperativemoocs] --- layout: center, middle Class: animated slideInright fadeOutLeft ## OVERVIEW .right-column[ >Designed to take measurements in spectral regions that’s have been used in previous satellite senors >Promotes continuity of data >Provides maps in several surface characteristics (....17 land cover types) >On boarded on Terra Satellite and Aqua Satellite > Viewing swath: 2330 km (cross track) by 10km (along track at nadir) > Data yield: 44 global data products > Design life: 6 years ] .left-column[ 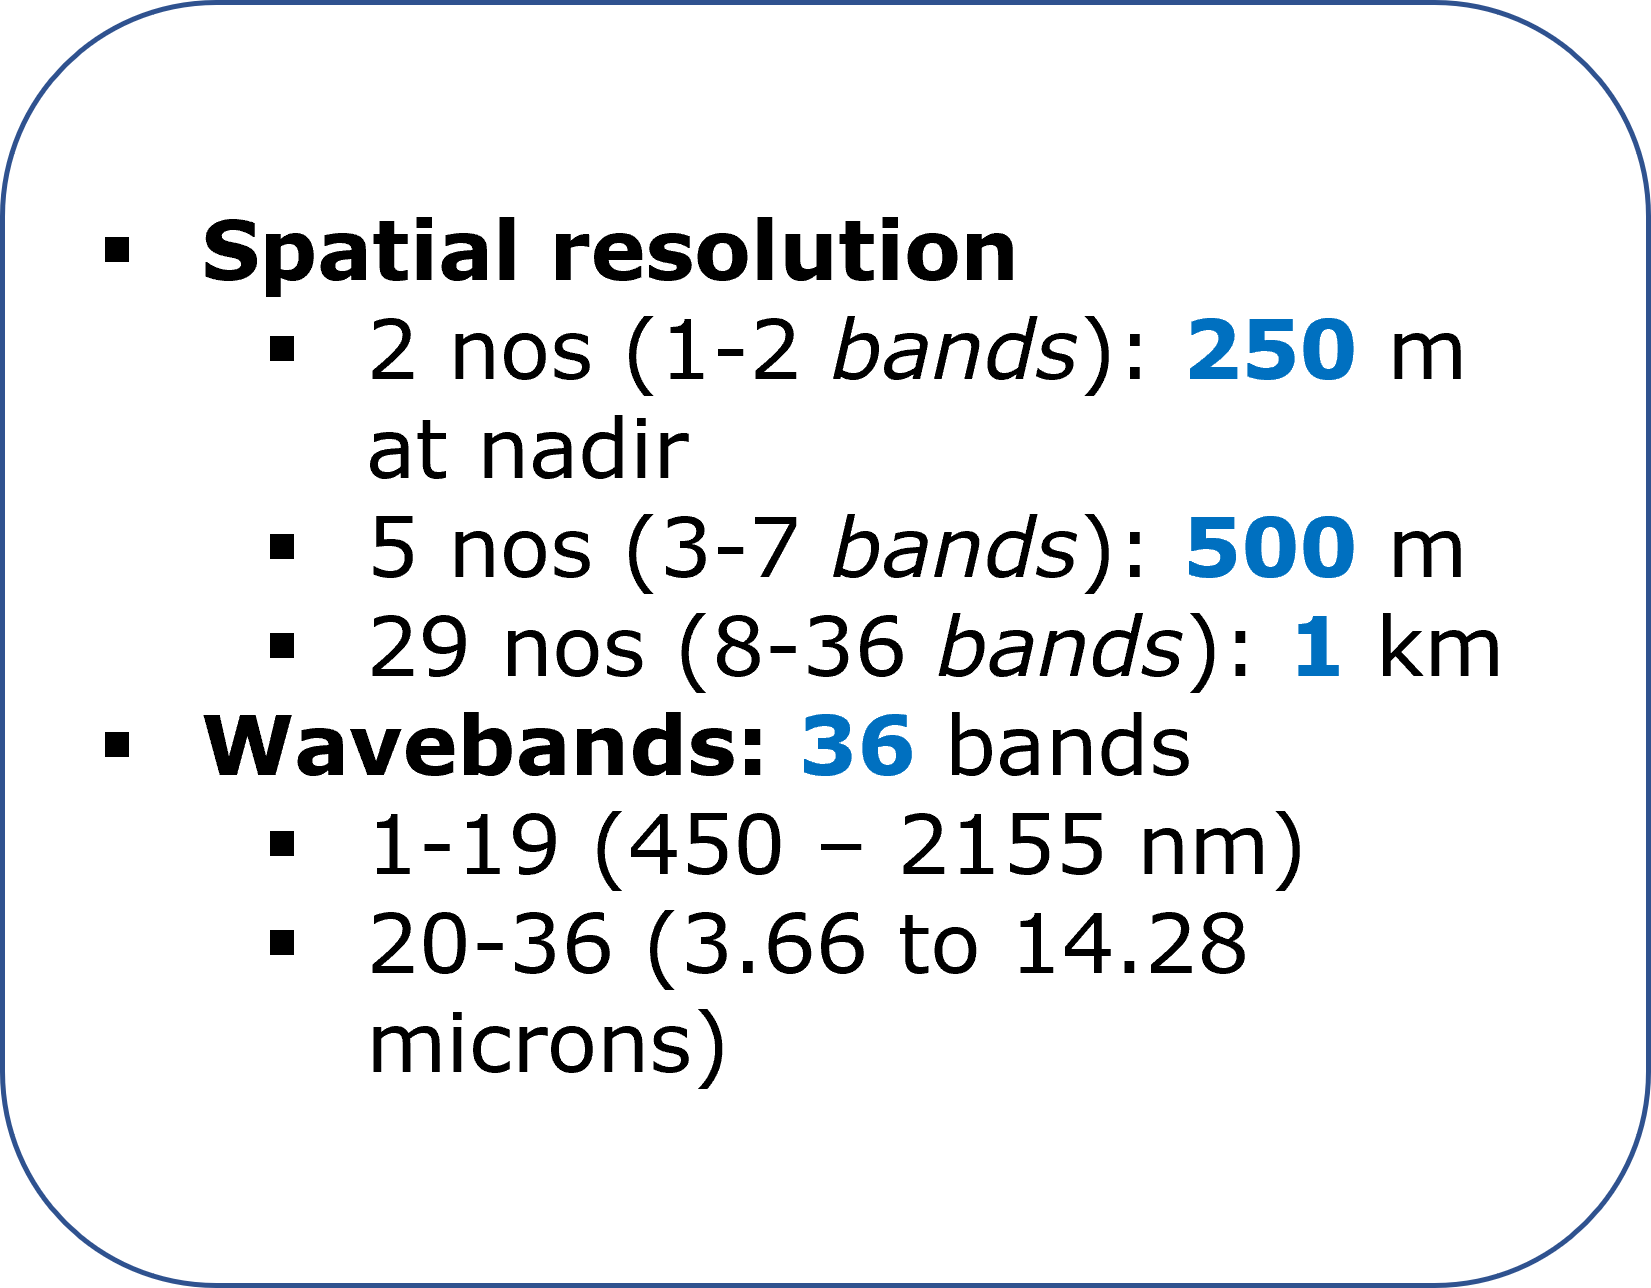 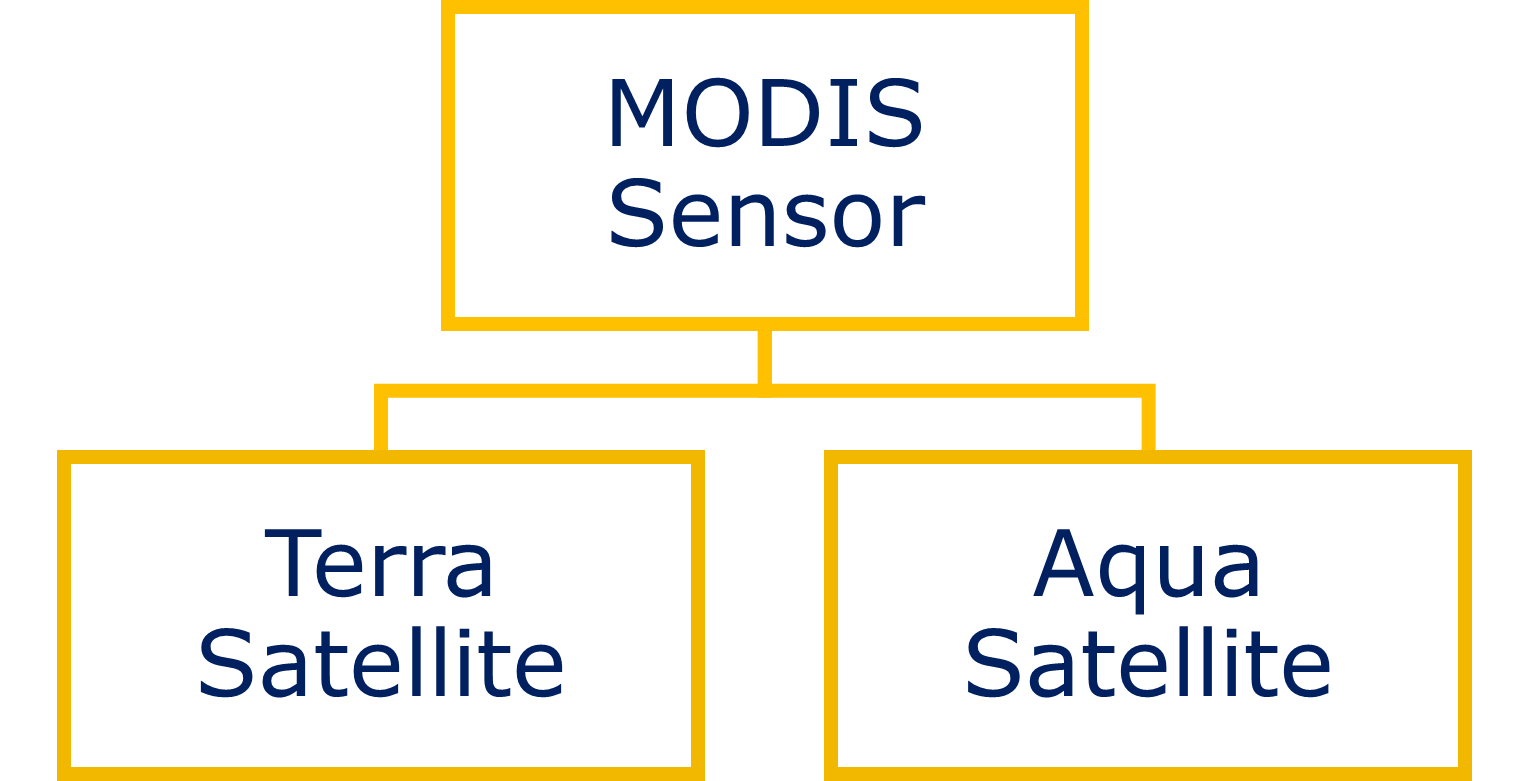  ] --- layout: center, middle class: center, middle .pull-left[ .center[**So who primarily uses this data?** Scientists and land managers **Why?** To take informed decisions **For?** Managing earth’s natural resources **How?** Monitoring and assessing **What?** Impacts of weather and climate changes • Human activities ] ] .pull-right[ **So how do these MODIS features help us??** .left[ >_Type of vegetation (11 categories)_: coniferous forests, deciduous forests, or cropland from grassland >_Type of non-vegetated surfaces_: including bare soil, water, and urban areas >_Modelling Earth’s_: Carbon cycle or Exchange ( Between Earth’s life, land, oceans, and atmosphere) ] ] --- layout: left, middle class: left, middle .panelset[.panel[.panel-name[Application] ##APPLICATION  .left[_Source:terra.nasa_] ] .panel[.panel-name[LAND] .pull-left[ - _Changes in vegetation_ - **biospheric stress**, such as pollution, drought, or temperature extremes- predict and prevent wildfire danger or crop failure - _Changes in land cover type_ > deforestation, grassland converting to cropland, burned land returning to natural vegetation - _Modelling carbon cycle_ > check increase in greenhouse gas (Carbon dioxide) > contributing to **global warming** - _Type of vegetation_, soil composition and temperature> **mass and energy exchange** ] .pull-right[ - _Global photosynthesis and productivity_> **Carbon source** and **Carbon sink** - Effects of diminishing carbon sinks - Effects of land use changes - Land surface temperature rise effects on frozen artic soils - _Role of snow cover and sea ice_ in climate change. - _Effects of global temperature_ increases on snow and sea ice’s thermal regulation of the planet ] ] .panel[.panel-name[OCEAN] .pull-left[ - Data > global maps of ocean color _(reflected by concentration of organisms in surface water- phytoplankton)_- measurements of chlorophyll and other pigments -**Why?**Phytoplanktons (biomass) > phytoplankton productivity > **carbon fixation** >> Earth’s Largest Carbon sink!! - _Sea surface temperature (SST)_- **rate of exchange** between the ocean and the atmosphere - Earth’s habitability - Potent Greenhouse gas (water vapor) - climate change - cloud formation, inc.thunderstorms and hurricanes - Understand and predict long term **climate changes** and short term **Climate events** (eg:El Niño) ] .pull-right[  .left[Sediment and Phytoplankton in the Gulf of Mexico. _Source:MODIS Land Rapid Response Team, NASA GSFC_] ] ] .panel[.panel-name[ATMOSPHERE] .pull-left[ - Better understanding of _cause-and-effect relation_ (Feedback loops) by understanding cloud properties - Weekly and monthly cloud-cleared products > used in _global change models_ - _Aerosols detection_ (Dust, sea salt, volcanic emissions, smoke from forest fires, and some kinds of pollution) - atmospheric heating > alter global air circulation and rainfall patterns - _Understanding relationships_ between clouds, precipitation, and aerosols> modelling and predicting consequence- global change. ] .pull-right[ Issue of Manmade Aerosols - Small - Numerous Clouds containing many man made aerosols - smaller liquid droplets - brighter than clouds with larger droplets - reflect more solar radiation back to space - cooling effect **But!** - Small droplets evaporate faster - More clouds but less rain ] ] ] --- layout: left, middle class: left, middle ###Examples of studies [(Kraatz, Khanbilvardi and Romanov, 2016)](https://www.sciencedirect.com/science/article/pii/S0165232X16301999) .pull-left[ - Purpose: River Ice Monitoring - Study area:Susquehanna River, US - Dataset and processing:MODIS - Data date: 2014, additional: 2002 & 2003 - visual Comparison data (CRIOS-CREST River Ice Observing System-MODIS:band1&2 ) date:2002 to 2012 - Aqua reflectance product MYD09GA ] .pull-right[ - Bands: 4 _(visible band)_ & 7 _(SWIR)_- to discriminate clouds from snow. _if need be -bands 6 & 7- differentiate b/w land and snow/ snow covered land_ + Observation Geometry - grid cell: 0.5km - cloud flag _(STATE_QA bit 0–1)_ - Additional source of validation: Landsat 8 - Other data: discharge data, discharge quality, in situ air temperature,flood observation data - MODIS cloud mask- bands 5 _(supplement flase color images- highlight location of snow cover and clouds)_,4 and 7 ] --- layout: left, middle class: left, middle ###Example of studies [(Doraiswamy et al., 2005)](https://www.sciencedirect.com/science/article/pii/S0034425705001355) .pull-left[ - Purpose:Crop Yield assessment - Desired output: retrival of crop biophysical parameters, integrated in crop yield simulation models & potential of MODIS 250m - Location:McLean County, Illinois, USA, 2000 - crops- corn and soyabean - classification of study area:NASS using Landsat TM images - Bands: all+ thermal (2 scenes- 25th Apr 2000 and 31st Aug 2000) - MOD12: not used- as it does not differentiate differnt crops - MODIS 250m investigated- its footprint over Landsat TM Classification ] .pull-right[ - MODIS Based classification- Bands 1& 2(8 day-five (DOY 113, 145, 169, 201, 233)) - Based on quality assessment and minimum cloud cover - Crop yield simulation- crop season data(daily average temperature, solar radiation and rainfall data) - Conducted: by data layers (daily average temp, solar radiation and rainfall) - grid: 1.6 × 1.6 km2 (because- standard grid for road network and landuse in the U.S. Midwest is 1.4 × 1.4 km2) - MODIS derived LAI profile was used to modify the crop model simulation of crop emergence - LAI and yield simulations (run separately- corn & soybean) ] --- layout: left, middle class: left, middle ###_Reflection_ .pull-left[ - Data from MODIS will help improve our understanding of earth (land, water and lowe atmosphere) - High visibility (every 1-2 days) - MODIS data is available in different levels (0,1A, 1B, 2, 2G, 3 and 4) - Product distribution level:250m, 500m and 1000m (Spatial resolution) - temporal composite:(daily/8-day/16-day/monthly/annual) - MODIS+ MISR +CERES > impact of clouds and aerosols in th eart - MODIS measures: properties of clouds ] .pull-right[ ]